
Download Asset Allocation | April 2025
Hot and Cold
Economic Update
A rocky path and continued volatility
By Regions Economic Division
History rarely remembers those who finish third. Yet if April finishes as it began, it will have the distinction of being the third most volatile month for the S&P 500 in as many decades, trailing only March of 2020 and October 2008. The latter is etched in the minds of many for having two of the largest daily percentage gains and two of the largest losses in S&P 500 history. It was during that quarter that Katy Perry’s “Hot ’n’ Cold” peaked at number three on the U.S. charts. Its message of ever-changing uncertainty resonates today with the current U.S. economic environment.
Announced tariffs on “Liberation Day” significantly exceeded expectations. Investor sentiment quickly moved from hot to cold, as expected tariffs surpassed those imposed by the Smoot-Hawley Tariff Act. Markets reeled, but just one week after tariffs were announced, the administration changed their mind. Yielding to pressure, a 90-day delay was enacted to provide time for negotiations. Markets subsequently moved up and then down, as new levies for countries and entire industries were put in effect and then taken out. Only one thing is for certain: Some tariffs will be imposed, and they will have a meaningful impact on inflation and economic growth. Will negotiations yield positive results? If not, how weak must the economy become for the Fed to act despite the risk of inflation? Will this be the year we find out?
In last month’s edition we discussed our growing concerns over the state of the U.S. economy. Although atypically harsh winter weather in both January and February made it difficult to gauge, it seemed clear that the economy had lost some momentum. Consumer and business sentiment were quickly souring, while a growing sense of uncertainty over the course of policy was weighing on businesses trying to plan for a future that seemed increasingly likely to look different from the future they had expected. Although we did not make a recession our base case, we did acknowledge that the risks to our baseline outlook were weighted to the downside.
A month later, we’re more, not less, concerned about the state of the U.S. economy. Although it was clear that higher and more broadly based tariffs were on the way, the tariffs announced on April 2 exceeded what many envisioned would be the worst-case outcome and would push the trade-weighted effective tariff rate to the highest in over 100 years. With global trade and supply chains upended in such drastic fashion, it’s all but given that the near-term effects will be slower economic growth and higher prices. What are now meaningfully higher downside risks to the labor market in turn pose risks throughout the economy, while businesses must rethink investment plans and map out what could be dramatically different supply chains.
The longer-term outcome is so uncertain that it seems futile to even try to assess what that may look like at this point in time. What none of us know at this point is whether, or to what extent, there is room for the tariffs announced on April 2 to be softened, and how long that might take. What we also do not know is to what extent and in what manner foreign countries will retaliate against higher U.S. tariffs, though China helped answer that question with their quick and stern response. While our April baseline forecast reflects a meaningfully more downbeat outlook, the reality is that there is so much uncertainty looming over the economy and financial markets that it’s hard to have much, if any, confidence in any forecast made at this point. It may be better to view forecasts being made at present as more of a directional guide than a destination, and it is likely of no more comfort to anyone else than it is to us, which is to say none at all, that the last time we felt this way was at the onset of the pandemic. Still, one thing we routinely stress is that starting points matter, and in that context, we think the following points are worth making.
Firms and households have taken steps over the past few months to avoid the impacts of higher prices and disjointed supply chains, and that poses the risk of a sharp and sudden slowdown in the middle quarters of 2025. For instance, we’ve pointed to notably strong spending on consumer durable goods over the final months of 2024, and that carried into this year as consumers have been pulling purchases of goods such as motor vehicles, appliances, electronics, and furniture forward to avoid tariff-related price hikes later this year. We can make the same point about retailers pulling orders forward and manufacturers pulling purchases of raw materials and intermediate goods forward for the same reasons. To the extent that such preemptive buying/inventory stocking supported Q1 real GDP growth, there will be payback, likely harsh, in the Q2 data.
Additionally, corporate profit margins remain meaningfully above historical norms, particularly compared to the years immediately prior to the pandemic, which gives firms capacity to absorb at least some portion of the increased costs of higher tariffs. It could be that many will go this route for some period of time to assess just how entrenched higher tariffs may prove to be before making longer-term decisions on capital spending and the size of their workforces. To that point, though by no means as hot as had been the case, the labor market is still solid. Total nonfarm employment rose by 228,000 jobs in March, and while some of that increase reflected payback for weather- related disruptions in January and February, the trend rate of job growth is right in line with the pre-pandemic average, and growth in aggregate labor earnings continues to outpace inflation. To be sure, between fallout from trade wars and cuts to federal government employment and spending, nonfarm employment will grow at a much slower pace, if not contract, while the unemployment rate will push higher. The disruptions in the labor market, however, would be even more severe were labor market conditions significantly weaker than they have been up until now.
In last month’s edition, we pointed to declines in equity prices triggering negative wealth effects as an emerging downside risk. Given the extent to which equity prices sank in the wake of the April 2 tariff announcements, that downside risk now seems significantly more pronounced. That said, we know from the Flow of Funds data that household net worth ended 2024 at $169.4 trillion, easily the highest on record, of which one key component is owner equity positions in residential real estate being stronger than they have been in decades. Even if we allow for a hit of $10 trillion in the form of lower equity prices thus far this year, that would leave net worth where it was at the start of 2024. Still, while there is considerable financial capacity in the household sector to absorb an adverse shock, one issue is that the most vulnerable households have no such cushion.
On the whole, the U.S. economy was on fairly solid ground prior to April 2, and while that cannot forestall the coming storm, it can at least help cushion the blow. The extent to which it does so, however, largely depends on whether April 2 was itself a starting point or the final word. One area in which the starting point clearly does not work in our favor is the fiscal condition of the federal government, a topic we discussed in our July 2024 edition. While the Congressional Budget Office’s (CBO) late-March update shows not much has changed – i.e., budget deficits expected to hover near $2 trillion per year over the next several years – we think this is a topic worth revisiting with mounting trade tensions, particularly given the extent to which the U.S. relies on foreign capital to help finance the federal budget deficits. Simply put, to the extent the U.S. begins to see diminished capital inflows because of disruptions in global trade flows, there are only two alternatives: either the federal government takes steps to substantially reduce the size of its deficits, or the aggregate level of investment in the U.S. economy falls dramatically, meaning lower real GDP growth and higher inflation.
The Flow of Funds data show net domestic saving in the U.S. was negative in Q4 2024, equivalent to 0.16% of GDP. In other words, dissaving in the government sector more than absorbed the entire stock of combined business and household saving. Recall that for any economy the aggregate level of investment must equal the aggregate level of saving which, for the U.S., means that foreign saving has been critical in sustaining high levels of investment in the U.S. economy. It also helps recall that, by definition, the flip side of a trade deficit is a capital inflow, meaning any factor that leads to diminished trade flows will also lead to diminished capital flows. Should a more fragmented global trade environment ultimately lead to the dollar ceding, even if only partially, its role as the de facto global reserve currency, that would put upward pressure on the interest rates at which the federal government will be able to find buyers of its debt obligations. At least in theory, steps being taken to reduce the size and scope of the federal government will contribute to the U.S. getting its fiscal house in order, though it is very much an open question whether the totality of these steps will make a meaningful dent in the path of deficits projected over the next decade-plus. Either way, the bottom line is that a diminished global footprint for the U.S. highlights the need for the U.S. to get its fiscal house in order.
Sources: U.S. Bureau of Economic Analysis; U.S. Bureau of Labor Statistics; Federal Reserve Board; Congressional Budget Office
Investment Strategy Update
Regions Multi-Asset Solutions & Highland Associates
Stocks face tough trends, but seasonality and elevated volatility are reasons for optimism. U.S. equity indices closed out March and wrapped up the first quarter of the year in negative territory as continued uncertainty surrounding tariffs and investors drastically lowering their expectations for investment in artificial intelligence (AI) initiatives weighed on sentiment and risk appetite. The largest U.S. stocks, with few exceptions, were a major drag on the S&P 500, evidenced by the Bloomberg Magnificent 7 index falling 10% in March and posting a nearly 16% year-to-date decline, with that weakness spilling over into April. With the April 2 announcement on tariffs in the rearview, market participants will now fix their gaze on quarterly earnings.
Earnings season kicks off in mid-April, and despite what has been a more universally downbeat economic outlook in the wake of tariff announcements, analysts and market prognosticators have so far only modestly revised their forecasts for corporate profits lower. That could change as S&P 500 companies post results. Full-year 2025 S&P 500 earnings estimates have gradually moved lower in recent months, but the consensus estimate is for approximately $269 in earnings this year, down from $273 on December 31, 2024. A broad swath of companies guiding future earnings lower or removing forward guidance altogether when they post results in the next couple of months should lead to sizable downward revisions to earnings estimates and help reset expectations and valuations. The market’s response to revisions is worth watching as stabilization in the face of negative earnings news would be encouraging. Despite what is expected to be a dire earnings season with few silver linings, there are reasons stocks could find their footing in the near term.
From a seasonality perspective, the calendar has historically turned more favorable for stocks in April. The S&P 500 has turned out a gain 64% of the time during the month dating back to 1928, with December the only month with a better “batting average,” and the index has generated an average monthly return of 1.3% over that time horizon, trailing only July’s 1.7% return. Given the challenging economic and policy backdrop currently in place, the calendar might not help stocks much this time around, but it’s worth watching for a potential offset to the negativity dominating headlines at present. On the sentiment front, equity investors remain justifiably skittish and negative with the first AAII Sentiment Survey in April showing 62% of respondents bearish on stocks over the next six months, well above the historical average of 31%. This is an extreme reading and highlights how it might not take much good – or perhaps just less bad – news on the trade/tariff front to improve sentiment and drive inflows into stocks.
Lastly, after the tariff announcement on April 2, stock prices have fallen sharply and the CBOE Volatility Index, or VIX, has moved higher in an equally unsettling manner due to a rapid rise in demand for hedges against additional market downside. Historically, VIX spikes such as this have preceded outsized advances for the S&P 500 in the 12 months to follow. Should the Trump administration pivot and focus on pro-growth policies – specifically, deregulation and tax reform – VIX should come down almost as quickly as it went up, with stock prices responding positively as a result. Secondarily, if our trading partners come to the negotiating table and the Trump administration makes some deals and takes some wins, headwinds facing equities in recent months could subside. Simplistically, the absence of negative headlines on the trade/tariff front might be enough to bring investors back into risk assets in the coming months, albeit in a more half-hearted or measured way.

Source: Bloomberg
Higher shareholder yield suggests international equities have staying power. International developed market stocks returned 7% in the first three months of the year, outperforming the S&P 500 by over 11% on a total return basis, marking the best quarter since 1986 relative to U.S., large-cap stocks. That advance makes up for the double-digit underperformance out of the MSCI EAFE index in the fourth quarter as the U.S. exceptionalism trade took hold, and apparently set the expectations bar far too low for international companies. Low expectations and cheaper valuations abroad have combined to act like a coiled spring this year, but unforeseen structural changes – specifically, a fiscal policy pivot out of Germany – also played a vital role. Germany’s increased willingness to issue debt to spend on defense and infrastructure in the coming years is potentially a watershed event, and if other EU countries take the opportunity to ease fiscal restraints to boost their economies, that could trigger capital flows out of the U.S. and into the eurozone.
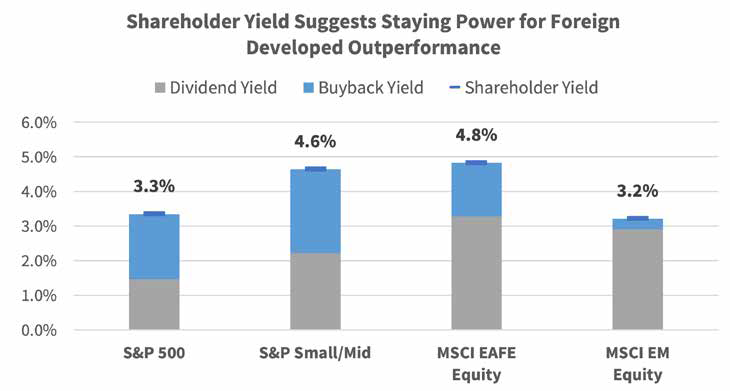
Narrowing economic growth differentials between the U.S. and developed markets abroad, along with the increasing appeal of higher-dividend-yielding stocks, suggest last quarter could be more than an oversold bounce for stocks tied to developed markets abroad. Along with some expected improvement in the fundamental backdrop abroad due to easier monetary and fiscal policies, valuations have room to run as stocks in Europe and Japan still trade far cheaper with the MSCI EAFE trading at 15X trailing 12-months earnings versus the S&P 500 at 20.6X. Unsurprisingly, dividend yield easily favors developed market stocks abroad, and after accounting for share buybacks the overall yield advantage over the S&P 500 grows, with the MSCI EAFE shareholder yield at 4.7% while the S&P 500 is closer to 3.2%. From our perspective, the stability of cash flows international equities provide still holds appeal, and considering the elevated volatility surrounding tariffs and a more uncertain growth environment, we like maintaining some exposure to cheaper, more shareholder-friendly companies tied to developed markets abroad.
Source: Bloomberg
The U.S. Treasury bond rally has run out of steam. U.S. Treasuries traded in a narrow range throughout March as a battle between market participants buying bonds in preparation for an economic slowdown and those more concerned that inflationary pressures would return as reciprocal tariffs were enacted continued to play out. Yields on Treasury bonds maturing inside of 10 years fell modestly during the month, with the 2-year Treasury yield, specifically, declining from 3.99% on February 28 to 3.89% on March 31. Farther out on the yield curve, the 10-year yield closed out the month a single basis point lower at 4.23% but fell through the floor in early April as the tariffs were announced, with the 10-year trading below 4% early in the month.
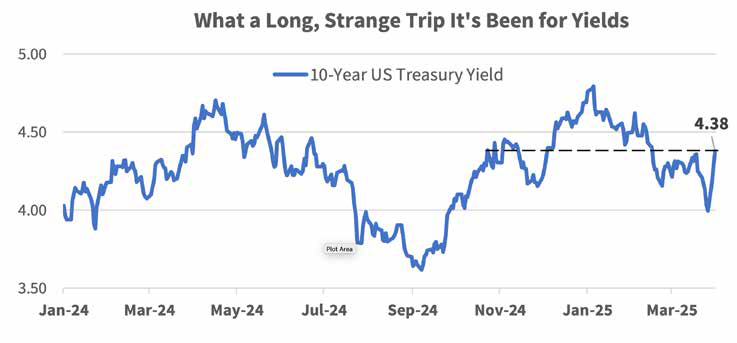
One quarter and a few weeks into the new year, yields on long-dated U.S. Treasuries have been on a roller coaster ride. The 10-year U.S. Treasury yield ran up to 4.80% in mid-January as pro-growth policies out of the new administration were priced in but dropped sharply from mid-February into the April 2 tariff announcement as trade uncertainty led to fears of an economic slowdown. On the heels of the tariff announcement, yields on long-dated Treasuries have risen sharply, with the 10-year above 4.40% as market participants have grown concerned that our trading partners will balk at buying our bonds as they demand fewer U.S. dollars and U.S.-dollar denominated assets. Tariffs being levied on a broad swath of U.S. imports is expected to put upward pressure on inflation, but corporations and consumers reigning in investment and spending in the face of uncertainty will contribute to economic growth concerns and likely keep a bid under high-quality, shorter-dated bonds as market participants value capital preservation over potential appreciation.
Our base case has called for long-dated U.S. Treasury yields to remain rangebound with the 10-year yield likely finding s ellers around 4.00% and buyers closer to 4.50%. Prior to the April 2 tariff announcement, economic growth concerns and inflation fears were largely in equilibrium, offsetting one another and bringing some relative calm to the Treasury market. But that dynamic has shifted, and investors appear increasingly concerned that inflation is going to rise materially at a time when demand for Treasuries could dry up. With the U.S. and trading partners such as Japan, South Korea, and the U.K. expected to come to the bargaining table in the near term, concerns surrounding foreign demand should ease somewhat, but the process of negotiating with more than 60 countries will be painfully slow. With the Federal Open Market Committee (FOMC) likely to remain on the sidelines in May and perhaps longer due to persistently sticky inflation, downside for Treasury yields could be limited.
Source: Bloomberg
High-grade is preferred over high-yield in the near term. March was a difficult month for riskier segments of the fixed-income market as high-yield corporate bonds lagged their investment- grade counterparts by 1.4% as valuations cheapened and credit spreads widened across the quality spectrum. The sharp rise in equity volatility driven by trade policy uncertainty and its potential downstream economic impacts have forced credit spreads wider for high-yield bonds by 80 basis points in April as of the time of this writing to 4.25% above similar maturity Treasuries, and the Bloomberg U.S. Corporate High Yield index now yields 8.30% after falling 0.7% year-to-date. Objectively, high-yield credits are getting cheaper but may not yet be cheap enough to fully account for the rising economic risks facing investors. Historically, riskier credits tend to participate in sell-offs once U.S. equities fall more than 5% and the VIX rises sharply, but to this point the sell-off in credit has been fairly contained and almost orderly.
The improved credit quality of the sub-asset class certainly plays a role in more muted volatility for high-yield bonds, but ultimately this is a risk asset that allocators and institutions typically lighten up on when the economic backdrop worsens and loss aversion bias creeps in. That opens high-yield bonds up to greater downside participation now that markets have started to more appropriately bake in the gravity of current circumstances. On the other end of the credit spectrum, investment-grade corporates still offered investors a 5.3% yield-to-worst in early April, and, for now, the deck is stacked in favor of investment- grade credit. But if volatility persists and stocks pull back further, forcing high-yield bonds to trade at deeper discounts with credit spreads surpassing landmarks like the 10-year average option- adjusted spread of 412 basis points, investors and allocators could find a yield-to-worst approaching 9% on high-yield bonds too juicy to pass up, assuming a deep and protracted recession isn’t the base case.
IMPORTANT DISCLOSURES: This publication has been prepared by the staff of Highland Associates, Inc. for distribution to, among others, Highland Associates, Inc. clients. Highland Associates is registered with the United States Security and Exchange Commission under the Investment Advisors Act of 1940. Highland Associates is a wholly owned subsidiary of Regions Bank, which in turn is a wholly owned subsidiary of Regions Financial Corporation. Research services are provided through Multi-Asset Solutions, a department of the Regions Asset Management business group within Regions Bank. The information and material contained herein is provided solely for general information purposes only. To the extent these materials reference Regions Bank data, such materials are not intended to be reflective or indicative of, and should not be relied upon as, the results of operations, financial conditions or performance of Regions Bank. Unless otherwise specifically stated, any views, opinions, analyses, estimates and strategies, as the case may be (“views”), expressed in this content are those of the respective authors and speakers named in those pieces and may differ from those of Regions Bank and/or other Regions Bank employees and affiliates. Views and estimates constitute our judgment as of the date of these materials, are often based on current market conditions, and are subject to change without notice. Any examples used are generic, hypothetical and for illustration purposes only. Any prices/quotes/statistics included have been obtained from sources believed to be reliable, but Highland Associates, Inc. does not warrant their completeness or accuracy. This information in no way constitutes research and should not be treated as such. The views expressed herein should not be construed as individual investment advice for any particular person or entity and are not intended as recommendations of particular securities, financial instruments, strategies or banking services for a particular person or entity. The names and marks of other companies or their services or products may be the trademarks of their owners and are used only to identify such companies or their services or products and not to indicate endorsement, sponsorship, or ownership by Regions or Highland Associates. Employees of Highland Associates, Inc., may have positions in securities or their derivatives that may be mentioned in this report. Additionally, Highland’s clients and companies affiliated with Highland Associates may hold positions in the mentioned companies in their portfolios or strategies. This material does not constitute an offer or an invitation by or on behalf of Highland Associates to any person or entity to buy or sell any security or financial instrument or engage in any banking service. Nothing in these materials constitutes investment, legal, accounting or tax advice. Non-deposit products including investments, securities, mutual funds, insurance products, crypto assets and annuities: Are Not FDIC-Insured I Are Not a Deposit I May Go Down in Value I Are Not Bank Guaranteed I Are Not Insured by Any Federal Government Agency I Are Not a Condition of Any Banking Activity.
Neither Regions Bank nor Regions Asset Management (collectively, “Regions”) are registered municipal advisors nor provide advice to municipal entities or obligated persons with respect to municipal financial products or the issuance of municipal securities (including regarding the structure, timing, terms and similar matters concerning municipal financial products or municipal securities issuances) or engage in the solicitation of municipal entities or obligated persons for such services. With respect to this presentation and any other information, materials or communications provided by Regions, (a) Regions is not recommending an action to any municipal entity or obligated person, (b) Regions is not acting as an advisor to any municipal entity or obligated person and does not owe a fiduciary duty pursuant to Section 15B of the Securities Exchange Act of 1934 to any municipal entity or obligated person with respect to such presentation, information, materials or communications, (c) Regions is acting for its own interests, and (d) you should discuss this presentation and any such other information, materials or communications with any and all internal and external advisors and experts that you deem appropriate before acting on this presentation or any such other information, materials or communications.
Source: Bloomberg Index Services Limited. BLOOMBERG® is a trademark and service mark of Bloomberg Finance L.P. and its affiliates (collectively “Bloomberg”). BARCLAYS® is a trademark and service mark of Barclays Bank Plc (collectively with its affiliates, “Barclays”), used under license. Bloomberg or Bloomberg’s licensors, including Barclays, own all proprietary rights in the Bloomberg Barclays Indices. Neither Bloomberg nor Barclays approves or endorses this material or guarantees the accuracy or completeness of any information herein, or makes any warranty, express or implied, as to the results to be obtained therefrom and, to the maximum extent allowed by law, neither shall have any liability or responsibility for injury or damages arising in connection therewith.