
Download Asset Allocation | April 2024
When Doves Cry
Economic Update
Inflation Not Going Away Quietly, if at All
By Regions Economic Division
In a long-ago time, when documents were actually printed, a popular phrase – “before the ink was even dry” – was used to describe how quickly things can change. As a timely example, were they to actually print them out and distribute them, one might say that the latest edition of the Federal Open Market Committee’s (FOMC) Summary of Economic Projections (SEP), issued in conjunction with their March 19-20 meeting, would have been obsolete before the ink was even dry. OK, sure, that may be at least a bit of an exaggeration, but it is nonetheless fair to ask if, were the FOMC to issue another edition of the SEP today, they would still envision the same paths of inflation and the Fed funds rate as they did just a few weeks ago.
Two elements of the March edition of the SEP bear noting here. First, the FOMC’s median forecast of core inflation was higher than that in the prior edition of the SEP, issued in December 2023. Moreover, the majority of FOMC members saw the risks to their inflation forecast as being weighted to the upside; i.e., if their forecast is wrong, they see inflation higher than their forecast as being more likely than inflation lower than their forecast, a marked shift from last December, when the majority of committee members saw the risks to their inflation forecast as being balanced. Second, despite the higher inflation forecast, the updated dot plot implied three 25- basis-point cuts to the Fed funds rate by year-end 2023, matching the path of the funds rate implied in the December 2023 edition of the SEP.
That the updated dot plot yielded the same implied path of the Fed funds rate is not as at odds with the higher inflation forecast as it may seem. First, individual projections of the funds rate were much more concentrated at or above the median dot than were the case with the December 2023 projections. To that point, had only one of the nine FOMC members indicating three funds rate cuts by year-end 2024 instead indicated only two cuts, the median dot would have shifted up to 4.875%, consistent with only two, not three, cuts this year. At the same time, the updated dot plot implies three 25- basis-point funds rate cuts in 2025, down from the four cuts implied in the December 2023 edition of the SEP. As to the question of whether an updated edition of the SEP would look the same as that issued in mid-March, we’re guessing the answer would be “no,” which in part reflects the tone of the economic data that have come out since the conclusion of the March FOMC meeting, but which also in part reflects the tone taken by several FOMC members in their public comments since the March meeting.
As to the economic data, the U.S. Bureau of Economic Analysis (BEA) released their final estimate of Q4 2023 GDP, which showed annualized real GDP growth of 3.4%, higher than the first two estimates and indicating that the U.S. economy carried strong momentum into 2024. The U.S. Bureau of Labor Statistics (BLS) reported that total nonfarm payrolls rose by 303,000 jobs in March, handily beating expectations, with the unemployment rate settling back to 3.8% after having jumped to 3.9% in February. The March employment report also showed an increase in the average length of the workweek, which helped fuel an outsized 0.8% increase in aggregate private sector wage and salary earnings, leaving them up 5.9% year-on-year. Recall that wage and salary earnings are the largest single component of personal income, and that private sector labor earnings have grown at a rate faster than inflation over this entire period of elevated inflation: this has been a key, though often overlooked, support for consumer spending.
In short, even though we and most others expect real GDP growth to have slowed in Q1 (the BEA’s initial estimate will be released on April 25), the labor market and the broader economy have proven to be much more resilient than many had expected coming into this year. As such, anyone who thought that the FOMC would by now be cutting the Fed funds rate as a response to flagging growth was clearly wrong. The rationale for the FOMC to begin cutting the funds rate that always made more sense to us, and to most others, was that further deceleration in inflation would give the FOMC grounds to begin cutting the funds rate to keep the real, or inflation-adjusted, funds rate from rising further, effectively making policy more restrictive. That rationale, however, has also been put to the test by inflation proving to be more persistent than many had expected coming into this year.
We noted in last month’s edition that aside from the January readings on the Consumer Price Index (CPI) and the PCE Deflator themselves, there were other early indicators of inflation that were cause for concern. Data released since then have reinforced, rather than allayed, those concerns. For instance, crude oil prices and retail gasoline prices have continued to rise sharply, and higher energy costs will push headline inflation further away from the FOMC’s 2.0% target rate. The Institute for Supply Management’s (ISM) monthly surveys of the manufacturing sector have now shown three straight months of rising prices for non-labor inputs and, perhaps more significantly, the underlying details show input price pressures becoming more broadly based across the manufacturing sector. This bears noting because rising prices for non-labor inputs have historically been a harbinger of upward pressure on prices for capital and consumer goods. Keep in mind that higher global shipping costs are being reflected in prices coming in (commodity prices) and prices going out (goods prices), adding to inflation pressures in the goods sector. It is more than coincidence that prices for imported consumer goods excluding energy have been pushing higher over recent months. At the same time, ex- shelter services price inflation remains more persistent than many had expected would be the case.
In early-April remarks at Stanford University, Fed Chair Powell noted that it was too soon to know whether higher than expected inflation over the early months of 2024 was “more than just a bump.” It could indeed be that all of this ultimately amounts to no more than a bump on inflation’s downward path, but you’d have to admit that’d be one heck of a bump. Moreover, many FOMC members have adopted a more guarded tone of late, which for some is along the lines of “rate cuts are still likely this year, but we’re in no hurry” and which for others is along the lines of “we may not cut the funds rate at all this year.” This is why we think an updated edition of the SEP issued today would look different from the one issued by the FOMC at their March meeting. More specifically, we think an updated dot plot would imply only two 25-basis-point cuts in the Fed funds rate by year-end 2024, rather than the three implied in the March SEP.
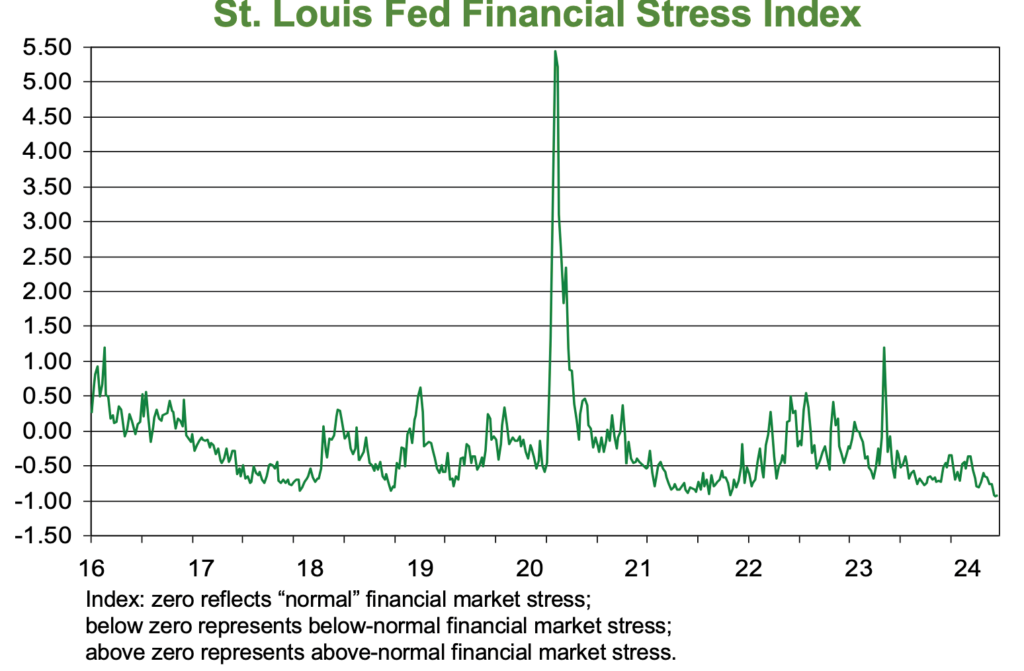
We could just as easily make a plausible case that there will be no funds rate cuts this year. Not only have the labor market and the broader economy proven to be quite resilient, but broad measures such as the Federal Reserve Bank of St. Louis’s Financial Stress Index show overall financial conditions continue to ease despite no Fed funds rate cuts and despite market interest rates backing up of late. At the very least, this makes a case that the FOMC has no reason to rush into a decision to begin cutting the funds rate. This also raises a very useful point to recall, which is that the absence of funds rate cuts need not be a death knell for economic growth and profit growth, a point which, however grudgingly, market participants seem to have come to terms with.
Sources: U.S. Bureau of Labor Statistics; Institute for Supply Management
Investment Strategy Update
Stocks: Sentiment, Valuations Stretched, but a Constructive Outlook Remains Warranted
Regions Multi-Asset Solutions & Highland Associates
After a 10% gain in the first quarter and a jaw-dropping 26% return since the end of October, the S&P 500 was due for a pullback or period of sideways consolidation to curb the unbridled optimism that had pushed stocks higher over the prior four months. A rapid rise in Treasury yields at the start of April appeared to be just what the doctor ordered on this front as investor unease became evident. But bears have, so far, only been able to muster a modest pullback in the S&P 500 – hardly indicative of a shift in market character. Treasury yields have moved higher year-to-date due to a combination of stronger U.S. economic data and sticky inflation prints which, assuming this backdrop remains in place over coming months, will have implications for the path forward for monetary policy and portfolio construction. However, at present, the necessary preconditions don’t appear to be in place to generate a deeper pullback as Treasury yields have been rising as the U.S. economy has proven resilient and expectations for cuts to the Fed funds rate have dimmed. This backdrop should lead to earnings growth over coming quarters, the most important underpinning of equity valuations/prices.
Unbridled optimism appeared to make an appearance in February and into March as some lower-quality pockets, such as unprofitable information technology and biotechnology stocks, along with a few of the more recent highly acclaimed initial public offerings (IPOs) garnered investor capital. However, with the Goldman Sachs nonprofitable tech index down 13.1% and the iShares Biotech ETF (IBB) eking out just a 1.1% year-to-date gain through March, signs of speculative excess in these corners of the market appear to be isolated and aren’t sending worrisome signals just yet. While frothy sentiment is certainly one indication that the rally might be on borrowed time, it’s notable that bullish respondents in the American Association of Individual Investor (AAII) Bull-Bear in late March rose to 50%, above the historical average of 37.5%, but still below the 52.9% peak reached in December of 2023. In short, a fear of missing out will at some point likely force sentiment to get frothier before the current run is over.
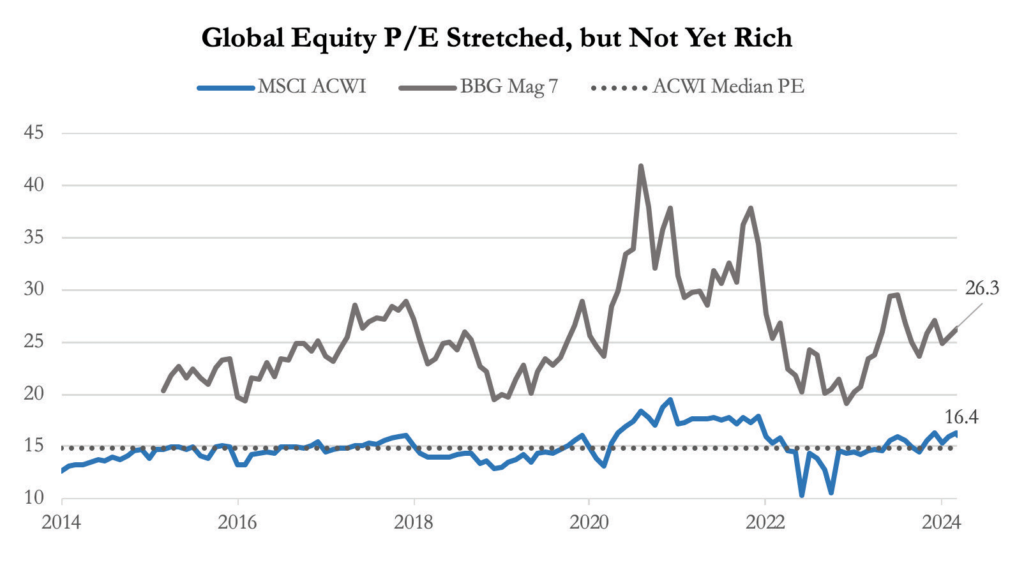
Stretched valuations for the “Magnificent 7” have long been cited by bears as reason to remain skeptical of the rally. But those concerns have so far proven unfounded, and capital has rotated both within the Mag 7 as well as out of communication services and information technology and into cyclical sectors as relative value investors have reallocated to benefit from an improved economic growth outlook. This rotation is an indicator of healthy price action and a market functioning as desired with stock-specific factors considered. While the Mag 7 as an equally weighted basket trades at 26.3 times forward earnings, when one looks beyond the behemoths at the top of the S&P 500, stock valuations appear less demanding. The S&P 500, excluding the Magnificent 7, trades at a little less than 19 times forward earnings, which is above the 5-year average of 17.6 times, but is below the peak of 20.7 times seen in August of 2020. While we’re not arguing that the S&P 500 is cheap even when excluding the Mag 7, the index has been more expensive than it is at present, and if the U.S. economy remains resilient, equity prices should grind higher alongside earnings growth. Stretched sentiment and valuations could present near-term hurdles and limit S&P 500 gains, but earnings growth should ultimately win out and push stock prices higher.
Sources: Bloomberg
Patience Required on Small Caps as Near-Term Headwinds Persist
Given the growing likelihood that the initial Fed funds rate will be pushed out beyond June, the interest rate environment is likely to favor domestic large-cap stocks relative to small and medium-sized companies. Ongoing labor market strength also points to persistent margin pressures for smaller firms as they are forced to pay up for workers. We entered 2024 constructive on small- and mid-
cap (SMid) stocks, and while the S&P Mid-Cap 400 index has fared well, rising 9.5% on year-to-date through March, small caps have done very little, with the S&P Small Cap 600 rising just 2% over the same time frame. Small caps could remain beholden to labor market data and Treasury yields over the near-term, but once the FOMC begins cutting rates, investors could quickly shift their attention to the leverage small caps have to a strong U.S. economy and focus less on potential profit margin headwinds.
As February rolled along, smaller capitalization stocks exhibited positive price momentum with some of the lower-quality, unprofitable pockets outperforming, a sign of improved investor risk appetite. This is a notable shift in sentiment for a pocket of the market that has lagged the S&P 500 by 20% since the end of 2022. This cohort hasn’t benefited from the AI frenzy to the same degree as large caps, instead experiencing positive momentum in cyclical areas like industrials and discretionary stocks. We continue to assess attractiveness in this sector of the market.
Broader Participation an Underappreciated Story
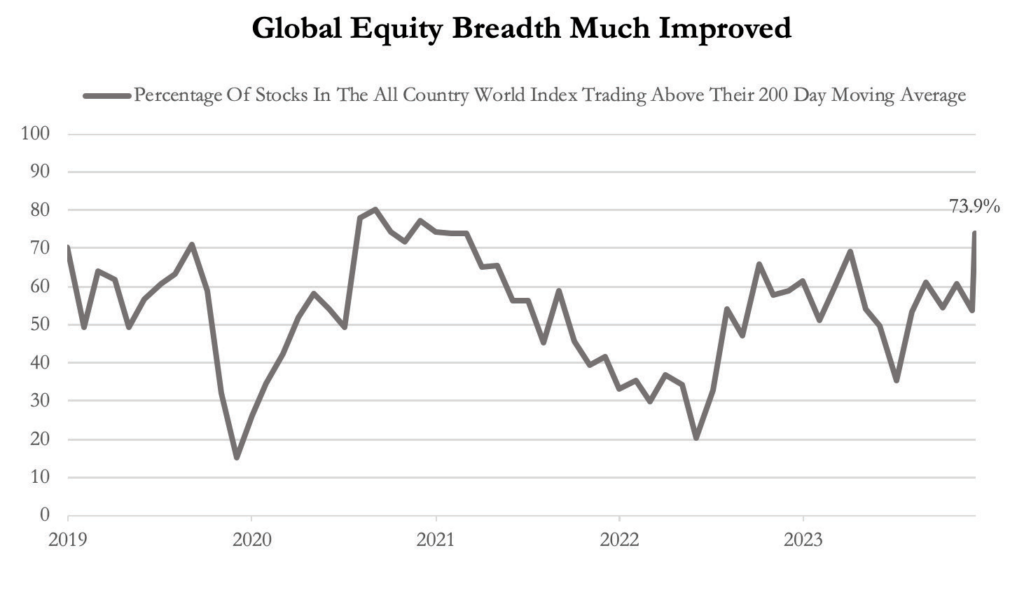
Improved breadth has been cited by market prognosticators, us included, as one big reason why the rally can continue, but often that is specifically in reference to the S&P 500. While more than 75% of the names in the S&P 500 were trading above their 200-day moving average in early April, a respectable figure, there are many country level benchmarks abroad that can make a similar claim. In early April, over two-thirds of the stocks traded on exchanges in Canada, France, Germany, Italy, Japan, Mexico, and Spain, among others, could say the same, which is an encouraging data point that shows it isn’t just U.S.-based technology stocks powering the sharp rally since the end of October.
Admittedly, many country indices saw price momentum wane as April began, evidenced by a smaller percentage of stocks trading above their 10- and 50-day moving averages. However, fewer stocks trading above their 200-day moving average would be more concerning, and by that metric global equities remain on solid footing. Stock prices often lead the economy, in both directions, and the improvement in equity markets in the U.K. and across Europe is pointing toward an improved outlook for the Eurozone economy and profits across the pond. Japanese stocks have outpaced other developed markets abroad by a wide margin over the past year but have faltered over the past month as the Japanese yen has weakened further, potentially forcing the Bank of Japan to tweak monetary policy further in the coming months. It is encouraging that Eurozone equities have picked up the slack and pulled the MSCI EAFE higher, leading to outperformance vs. the S&P 500 over that time frame. Abroad, developed market indices have much larger exposures to cyclical sectors and less exposure to the communication services and information technology sectors that have pulled the S&P 500 higher in recent years. A global economic upturn could provide an outsized boost to foreign developed market stocks over coming quarters, and low relative valuations could begin to get the attention of investors that have been consistently under- allocated to these markets over the prior decades.
Sources: Bloomberg
Bonds: Yields Rising Even as “Hawkish” Rhetoric Ramps Up
On the heels of the FOMC’s March meeting, an absence of hawkish rhetoric and Chair Jerome Powell’s post-meeting comments were taken by the market as confirmation that the committee was leaning toward easing monetary policy relatively soon. The bond market initially rallied. However, with many economic data releases from March continuing to point toward a strong and resilient U.S. economy, market participants appear to view the FOMC’s outlook for
the path forward for inflation as overly optimistic and are pushing back by demanding higher yields on long- term Treasuries as a result.
FOMC speakers have presented a united and more hawkish front when speaking publicly of late, but market participants are concerned about dissension within the FOMC’s ranks potentially leading to greater uncertainty surrounding the path forward for monetary policy. With the U.S. economy strong and inflation remaining sticky, lower Treasury yields appears limited and risks appear skewed to the upside for rates, leading us to temper our expectations for core investment- grade fixed income over the near-term.
The Rich Can Still Get Richer
It’s been a decent start to the year outside of core investment-grade fixed income as high-yield and emerging market debt closed out March with gains. Both segments were two of our preferred areas to deploy capital at the start of this year and, even after a solid start to the year, we remain constructive on these areas over the balance of 2024. The Bloomberg U.S. High Yield index turned out a 1.4% gain during the first quarter but still yields 7.6% after an impressive 11% trailing 12-month return. While defaults are expected to rise at a modest pace over coming quarters, this yield appears “safe” to us given our view that U.S. economic growth will likely remain resilient, boosting corporate profits. Also, with a duration of just three years, high-yield should be relatively insulated should inflationary pressures remain sticky or reaccelerate from here, forcing Treasury yields higher in the coming months.
Higher-yielding, lower-quality credits could garner inflows even if interest rate volatility persists so long as U.S. economic growth remains resilient, but it is essential to consider what could discourage additional dollars from flowing into riskier bonds. Inflationary pressures reversing course and moving higher in a sustained manner could
prompt a more cautious stance. Under this scenario, policymakers could have limited appetite/ability to come to the rescue and combat any market-related stress, as tamping down inflation would be the priority. While this scenario could play out, fundamentals still take precedent, and credit conditions remain benign and are supportive of further, albeit more modest, spread tightening.
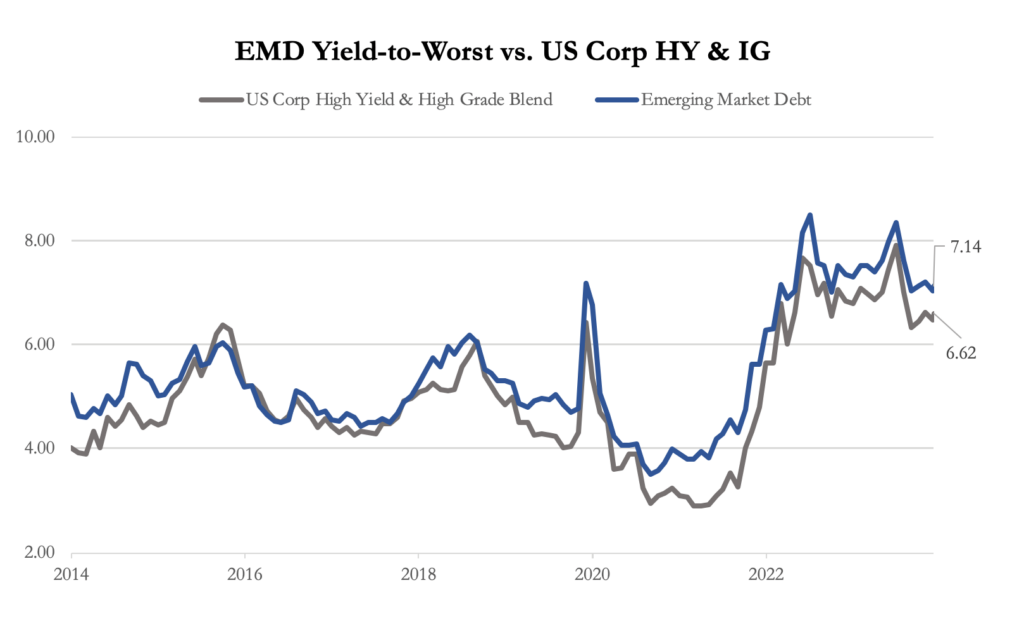
The combined benefit of higher yields and tighter credit spreads buoyed the J.P. Morgan Emerging Market Bond Index (EMBI), leading to a 1.5% year-to-date return through March. High starting yields coming into the year led us to conclude that positive returns for EM debt should be easier to come by going forward, but improved credit profiles for some of the most suspect nations in the EM index have exceeded even the optimistic forecasts thus far. High- yield country issuers at the aggregate level saw credit spreads tighten from 600 basis points at year-end 2023 to just 530 basis points at the end of March, evidence that investors require a lower-risk premium as some EM issuers undertake fiscal austerity measures supportive of paying down existing debt. Despite the resurgence in developing debt fundamentals, investors still appear under-allocated with EM sovereign credit ETFs registering outflows in four of the prior six months. Demand could turn a corner as the FOMC begins cutting rates, as the U.S. dollar could weaken, and investors seek higher-yielding alternatives outside of short-term cash-like instruments. Emerging market credit spreads have tightened in recent months due to improved fundamentals, which should encourage investors to kick the tires rather than avoid them, especially if the macro backdrop continues to improve. When comparing EM debt against domestic proxies of similarly rated credits, we think the premium for holding EM debt is still high enough to attract investors.
Sources: Bloomberg
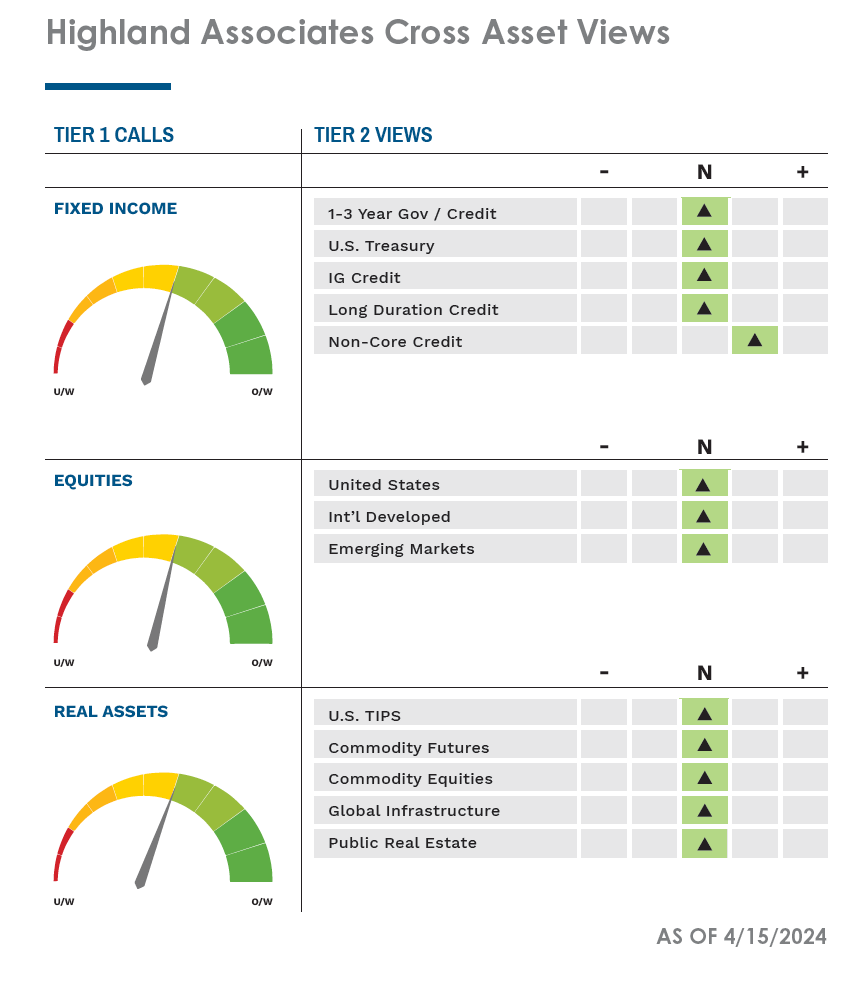
Heading into Q2, our preference is to remain selective and nimble, emphasizing diversification and favoring income- oriented investments. Although significant uncertainties remain, recession appears unlikely. Against this backdrop, equities should continue to grind higher across regions alongside stable and improving economies. Non-core fixed income sectors like high-yield, emerging market bonds, and private debt too. In the event risk of a recession rises, we expect the historical pattern of negative correlation between bonds and equities to reassert itself. At the same time, a basket consisting of Treasury Inflation-Protected Securities (TIPS), commodities, and inflation-sensitive equities offer reasonably priced protection against upside U.S. inflation scenarios.
As of 04/15/2024