
Download Asset Allocation | April 2022
Good Times, Bad Times
After reviewing the economic and market environment, Highland and Regions offer the following comments on the current landscape:
Economic Update
Economic Slowdown Was Already Underway
By Regions Economic Division
This just in: The U.S. economy is slowing and the demand for labor is cooling. While we do not find either to be at all surprising, many analysts and many market participants are in full Captain Renault mode, shocked to learn that an economy that recently seemed so strong suddenly seems to be teetering toward recession. Many are attributing this seemingly sudden turnabout to the recent stress in the banking system, an explanation far more convenient than convincing. At the same time, many analysts are busy ratcheting down their growth forecasts on the premise that further tightening in credit conditions will push the economy closer to, if not over, the edge. Doing so, however, entails relying on a series of assumptions made necessary by the fact that, at this point, no one knows the extent to which there are additional stresses lurking within the banking system and how those stresses may impact the broader economy. While by no means dismissing out of hand the possibility of additional stress within the banking system, we’re simply saying it’s more than a bit premature to attempt to quantify the impact of any such stress on the broader economy.
We do think both topics – the seeming turn in the economic data and the recent stresses in the banking system – are worth discussing further. Though some are interpreting recent bank failures as a signal of systematic stress across the banking system, those failures seem more idiosyncratic than systematic. That said, there will be those banks with significant clusters of larger (i.e., uninsured) deposits that will be vulnerable to deposit runs, which, as was recently illustrated, can come quickly and without warning. Additionally, there will be those banks with outsized exposure to certain asset classes, such as commercial real estate, that may come under stress due to deteriorating credit performance. This does not mean all banks are vulnerable to those risks, nor does it mean that all banks vulnerable to those risks will be impacted to the same degree.
While it could be that banks in general become more cautious and concerns over liquidity lead them to curtail lending, that won’t necessarily be the case across the board. To that point, the weekly data on deposit and loan balances show distinctly different patterns among large banks (higher deposit balances, higher loan balances) and small banks (lower deposit balances, lower loan balances) over the last two weeks of March. Should these patterns continue, there will be fallout across the broader economy, such as smaller firms being left to find alternative financing sources, but the drag on the economy would not be as severe as if larger banks were to pull back on lending activity.
Another point that has, quite curiously, gone largely overlooked in discussions of how stresses in the banking system may lead to tighter credit conditions is the extent to which credit conditions had already been tightening well before the recent bank failures. To that point, the Federal Reserve’s quarterly Senior Loan Officer Opinion Survey on Bank Lending Practices (SLOOS) had shown bank lending standards being raised across all the main lending categories in the quarters ahead of the recent bank failures. So, to the extent there will be further tightening in bank lending standards, that will come on top of the tightening that took place over the final three quarters of 2022. As a side note, in the case of mortgage loans, lending standards were ratcheted sharply higher in the wake of the housing market debacle associated with the 2007–2009 recession and were never eased to any material degree. At the same time they’ve shown lending standards being raised, the SLOOS data have also shown falling demand for consumer and commercial loans, which has played into our expectations of meaningfully slower growth in both consumer and business spending over coming quarters.
That gets us to the other topic we raised above, which is the slowing pace of economic activity, including the labor market. In last month’s edition, we noted the extent to which the seeming strength in the economic data for the month of January was little more than favorable seasonal adjustment flattering the headline numbers atop the various economic data releases. In other words, the “reacceleration” in economic growth in early 2023 was more myth than reality. Many analysts and market participants, however, reacted to those, well, inflated headline numbers, as evidenced by sharp increases in market interest rates in February and the first half of March and expectations of a more aggressive policy stance by the FOMC.
We also noted in last month’s edition that there would be payback for the “strong” January data in the data for subsequent months, which is what we think we’re starting to see. You can think about it this way: The lull in economic activity seen in January of any given year was not as pronounced this year, meaning that seasonal adjustment made the January economic data look better than it actually was. Conversely, the pickup in the pace of economic activity seen in March and April of any given year is likely to be less pronounced this year, meaning that seasonal adjustment will make the economic data look weaker than it is. As we often note, we rely heavily on analyzing the patterns in the not seasonally adjusted data and, on that basis, it seemed clear to us that the economy began to slow over the latter stages of 2022 and, despite what the seasonally adjusted data were showing, things didn’t appear all that different to us as we processed the January data. One manifestation of the slowing pace of economic activity in late 2022 was the declining loan demand reported in the SLOOS data, which was affirmed in the high frequency data showing consumer spending on discretionary services and business orders for core capital goods were declining. That carried over into early 2023, at least as reported in the not seasonally adjusted data. Our hunch is that many were lulled into a false sense of confidence by the seeming strength in the seasonally adjusted data for the month of January and are now surprised by the seemingly sudden turnabout in the data for much of February and that available thus far for March, including a marked deceleration in the pace of job growth.
The reality is that an economy as large as the U.S. economy does not turn on a dime, which is a useful point to keep in mind when listening to some try to make a causal link between the stress in the banking system over the last half of March and what has been an ongoing slowdown in the pace of economic activity. To be sure, further stress in the banking system and, even more significantly, signs of stress among the nonbank lenders would likely have a meaningful adverse impact on the U.S. economy, perhaps even pushing it into recession. It is, at this point, simply too soon to be making forecasts of whether, or to what extent, that will happen. We have from the start noted that 2023 would be a challenging year for the U.S. economy. That would have been true even absent concerns over financial stability, but it is even more so the case now.
Sources: U.S. Bureau of Economic Analysis; U.S. Bureau of Labor Statistics; U.S. Census Bureau; Federal Reserve Board of Governors
Investment Strategy Update
By Highland Associates and Regions Multi-Asset Solutions
The S&P 500 closed out the quarter on a high note, rallying 3.6% in March and ending 1Q23 with a 7.5% total return. Developed market equities also built on gains from 4Q22, with the MSCI EAFE Index rising 8.5% during the period. Domestic small-cap stocks didn’t fare as well, with the Russell 2000 delivering a 3.3% quarterly gain after falling 4.7% during March as the prospect of tighter credit conditions weighed on earnings expectations for this cohort. Within fixed income, volatility in interest rates was an ever-present overhang for markets throughout the first quarter as Treasury yields trended lower during January, rose sharply in February, and dropped just as aggressively in March, with the 10-year Treasury yield, specifically, falling from 3.92% at the beginning of the month to 3.48% at month-end. While the magnitude of moves in Treasury yields has been unsettling of late, bonds of all type managed to turn out gains of 2.0% or more during the quarter, with investment-grade and high-yield corporate bonds leading the charge, rising 3.1% and 3.0%, respectively.
Despite the S&P 500’s strong 1Q23 performance, narrow sector leadership remains a yellow flag in the U.S. as just three sectors – communication services, consumer staples, and information technology – outperformed during the month. Fewer stocks participating in the March rally relative to January’s bounce, small-caps consistently lagging large-caps, high-yield corporate bonds trailing investment-grade, and the S&P 500 rallying alongside safe-haven assets such as Treasuries and gold are ample reasons to remain skeptical of the staying power of the year-to-date rally in equities.
Quarterly earnings season also begins in mid-April, with the current consensus estimate calling for S&P 500 earnings per share (EPS) to fall 6.0% versus the first quarter of 2022. Earnings estimates have now been ratcheted lower for 10 consecutive months, and while we acknowledge that there is quite a bit of bad news already factored in for this quarter and next, estimates for the back-half of this year and for 2024 still appear too lofty as the negative impact of tighter monetary policy and credit conditions have yet to be priced in. S&P 500 earnings are still projected to rise 2.6% year-over-year in the September quarter and 9.6% year-over-year in the December quarter, followed by year-over-year growth of 12.2% in 2024, and that’s based on the assumption that the S&P 500 can generate EPS of $220 in 2023, which we doubt.
Offering up yet another forecast for S&P 500 earnings isn’t of much use, but the trend in earnings will matter, and with the consensus calling for EPS of $220 for 2023, we would “take the under” on that figure, implying that the S&P 500 is even more richly priced at present than is currently appreciated. The stock market isn’t the economy, but economic growth and earnings growth are connected, and with GDP growth expectations likely to decline and the labor market showing some signs of cooling, it will be difficult for equities to tune out less constructive economic news. We continue to hold a defensive position in portfolios with a bias to shorter duration bonds and select alternatives in lieu of stocks. While we’ve seen some improvement in the Highland Diffusion in recent months, four of the six framework indicators are still signaling risk-off, including Economic, Monetary Policy, Yield Curve, and Credit Spreads.
Clamoring for Cash
Institutional money market funds took in approximately $307B from allocators during March, the largest monthly inflow since April 2020, when $435B entered the market. Simultaneously, banks stepped up demand for the Fed’s repo facility as they attempted to shore up liquidity by swapping Treasuries for cash in the overnight market. Transactions in the overnight lending market have been large, albeit orderly, to date, a trend that can’t be taken for granted as cash markets can provide a useful real-time gauge of liquidity, or the lack thereof. Initially, the uptick in money market inflows appeared to be driven by a knee-jerk reaction to banking sector liquidity concerns. However, given the measured spacing of weekly flows, investors seeking to harvest year-to-date gains in stocks and protect profits are also likely contributing to inflows, along with fixed income investors shifting bond allocations to cash to clip an attractive yield while limiting exposure to heightened interest rate volatility. With many money markets yielding 4.75% or thereabouts, cash and shorter-term bonds are an appealing place to invest now until a more favorable entry point for risk assets presents itself.
Highland Associates Cross Asset Views
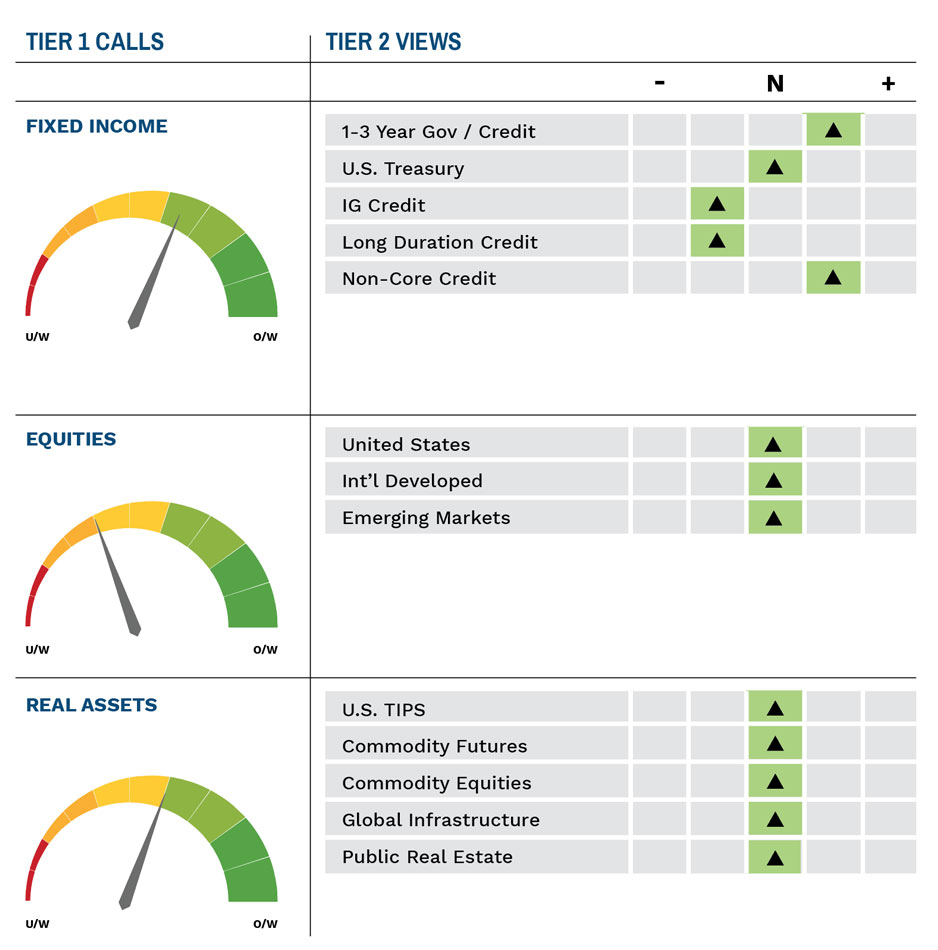
As of 4/17/2023
IMPORTANT DISCLOSURES: This publication has been prepared by the staff of Highland Associates, Inc. for distribution to, among others, Highland Associates, Inc. clients. Highland Associates is registered with the United States Security and Exchange Commission under the Investment Advisors Act of 1940. Highland Associates is a wholly owned subsidiary of Regions Bank, which in turn is a wholly owned subsidiary of Regions Financial Corporation. Research services are provided through Multi-Asset Solutions, a department of the Regions Asset Management business group within Regions Bank. The information and material contained herein is provided solely for general information purposes only. To the extent these materials reference Regions Bank data, such materials are not intended to be reflective or indicative of, and should not be relied upon as, the results of operations, financial conditions or performance of Regions Bank. Unless otherwise specifically stated, any views, opinions, analyses, estimates and strategies, as the case may be (“views”), expressed in this content are those of the respective authors and speakers named in those pieces and may differ from those of Regions Bank and/or other Regions Bank employees and affiliates. Views and estimates constitute our judgment as of the date of these materials, are often based on current market conditions, and are subject to change without notice. Any examples used are generic, hypothetical and for illustration purposes only. Any prices/quotes/statistics included have been obtained from sources believed to be reliable, but Highland Associates, Inc. does not warrant their completeness or accuracy. This information in no way constitutes research and should not be treated as such. The views expressed herein should not be construed as individual investment advice for any particular person or entity and are not intended as recommendations of particular securities, financial instruments, strategies or banking services for a particular person or entity. The names and marks of other companies or their services or products may be the trademarks of their owners and are used only to identify such companies or their services or products and not to indicate endorsement, sponsorship, or ownership by Regions or Highland Associates. Employees of Highland Associates, Inc., may have positions in securities or their derivatives that may be mentioned in this report. Additionally, Highland’s clients and companies affiliated with Highland Associates may hold positions in the mentioned companies in their portfolios or strategies. This material does not constitute an offer or an invitation by or on behalf of Highland Associates to any person or entity to buy or sell any security or financial instrument or engage in any banking service. Nothing in these materials constitutes investment, legal, accounting or tax advice. Non-deposit products including investments, securities, mutual funds, insurance products, crypto assets and annuities: Are Not FDIC-Insured I Are Not a Deposit I May Go Down in Value I Are Not Bank Guaranteed I Are Not Insured by Any Federal Government Agency I Are Not a Condition of Any Banking Activity.
Neither Regions Bank nor Regions Asset Management (collectively, “Regions”) are registered municipal advisors nor provide advice to municipal entities or obligated persons with respect to municipal financial products or the issuance of municipal securities (including regarding the structure, timing, terms and similar matters concerning municipal financial products or municipal securities issuances) or engage in the solicitation of municipal entities or obligated persons for such services. With respect to this presentation and any other information, materials or communications provided by Regions, (a) Regions is not recommending an action to any municipal entity or obligated person, (b) Regions is not acting as an advisor to any municipal entity or obligated person and does not owe a fiduciary duty pursuant to Section 15B of the Securities Exchange Act of 1934 to any municipal entity or obligated person with respect to such presentation, information, materials or communications, (c) Regions is acting for its own interests, and (d) you should discuss this presentation and any such other information, materials or communications with any and all internal and external advisors and experts that you deem appropriate before acting on this presentation or any such other information, materials or communications.
Source: Bloomberg Index Services Limited. BLOOMBERG® is a trademark and service mark of Bloomberg Finance L.P. and its affiliates (collectively “Bloomberg”). BARCLAYS® is a trademark and service mark of Barclays Bank Plc (collectively with its affiliates, “Barclays”), used under license. Bloomberg or Bloomberg’s licensors, including Barclays, own all proprietary rights in the Bloomberg Barclays Indices. Neither Bloomberg nor Barclays approves or endorses this material or guarantees the accuracy or completeness of any information herein, or makes any warranty, express or implied, as to the results to be obtained therefrom and, to the maximum extent allowed by law, neither shall have any liability or responsibility for injury or damages arising in connection therewith.