Stocks: Santa Claus Finally Shows Up For Investors; Cyclicals, Value Outperforming Defensives, Growth Early In The New Year; SMid Outperforms As Cyclical Sectors Lead; South Korea Leads, Picking Up Right Where It Left Off, But Latin America Looks To Be Joining The EM Rally.
Download Weekly Market Commentary | January 12 2026
What We’re Watching:
- U.S. Consumer Price Index (CPI) for December is released Tuesday. Both headline and core CPI are expected to rise at 0.3% month over month and 2.7% year over year.
- Quarterly reporting season kicks off in earnest with J.P. Morgan, Bank of America, Citigroup, Wells Fargo, Goldman Sachs, Morgan Stanley, and Blackrock, among others, all slated to post results. The start of earnings season is a welcome event and should shift attention away from geopolitics and monetary policy and toward the fundamental outlook for stocks in the quarters to come.
- Initial jobless claims for the week ended January 10th and continuing claims for the week ended January 3rd are released Thursday following readings of 208k and 1,914k the prior week.
Key Observations
- There has been a pronounced shift in favor of cyclicals, value, and smaller capitalization stocks to kick off the year as capital has shifted out of secular growth exposures tied to the AI theme. Within the S&P 500, the consumer discretionary, consumer staples, energy,financials, health care, industrials, and materials sectors have outpaced the broader index, while last year’s winners in the communication services, information technology, and utilities sectors have lagged.
- Abroad, both developed and emerging market stocks have picked up where they left off after rallying sharply in December and outpacing U.S. indices. Emerging markets have surged with country exposures tied to Brazil, China, South Korea, and Taiwan leading contributors, while India continues to detract. On the developed markets side of the ledger, gains have been broad-based, but Japan has been one of the most positive stories abroad with the MSCI Japan index already higher by 4.7% so far this year.
- High yield corporate bonds were one of the best performing fixed income sub-asset classes on the week despite some $10B-plus of below investment grade issuance. This is further evidence that investor risk appetite remains robust and that there remains a willingness to pick-up riskier credits even as high yield corporate bonds change hands at some of the loftiest valuations seen in the past two decades.
What Happened Last Week:
Stocks: Santa Claus Finally Shows Up For Investors; Cyclicals, Value Outperforming Defensives, Growth Early In The New Year; SMid Outperforms As Cyclical Sectors Lead; South Korea Leads, Picking Up Right Where It Left Off, But Latin America Looks To Be Joining The EM Rally.
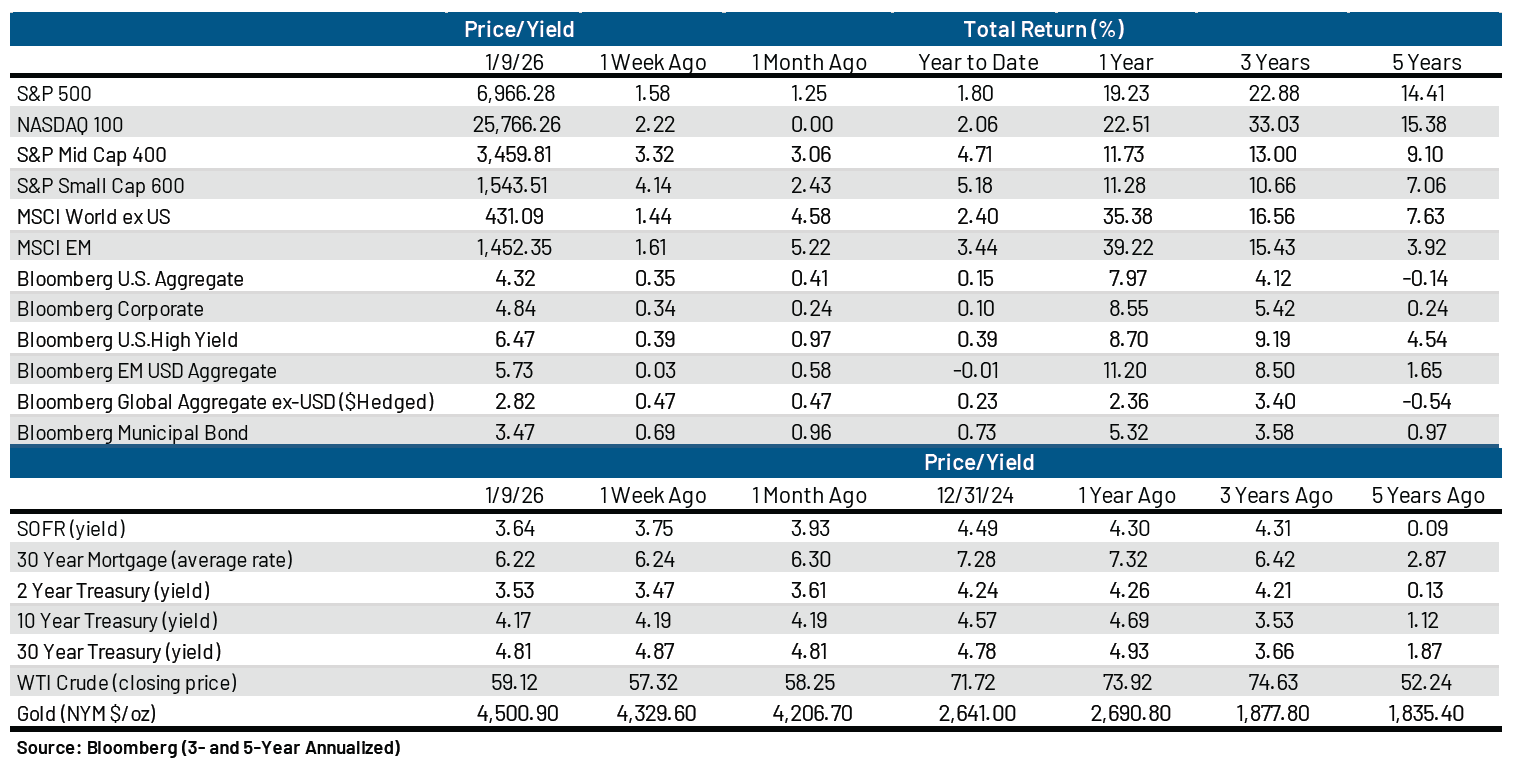
U.S. Indices Rally To Kickoff The New Year With Cyclicals Favored Over Defensive And Growth Sectors. U.S. indices have had a good start to the new year, with the S&P 500 higher by 1.7%, the S&P 400 Midcap index gaining 4.6%, and the S&P Small Cap 600 jumping 5.1% already just six trading days into 2026. While the S&P 500’s 1.7% gain is more than respectable, we are even more encouraged by what we have seen under the surface up to this point. Investors have come out of the gate looking to play offense by seeking relative value outside of last year’s AI-related winners in the communication services, information technology, and utilities sectors, each of which has lagged the S&P 500’s return one week into the year. This shift in preferences has spurred broad-based gains in economically sensitive sectors with consumer discretionary, energy, financials, industrials, and materials all higher by 1.7% or more early in the new year. Even the health care sector, which has traditionally been viewed as defensive, is already up by 1.6% as biotechnology and pharmaceutical stocks have garnered increased investor interest due to hopes for a robust year ahead on the mergers and acquisitions (M&A) front as larger drug manufacturers look to plug holes in their portfolios that are expected to develop between now and 2030 as a broad swath of drugs go off-patent between now and then. Quarterly reporting season kicks off this week, and we expect a positive tone to drive continued upside for U.S. indices in the coming month(s), giving investors reasons to refocus on fundamentals and corporate profits instead of geopolitics and the outlook for monetary policy in the year to come.
SMid Shines As Investors Seek Value, Embrace The “January Effect.” Historical seasonal trends were evident in the first full week of trading in the new year as the S&P Small Cap 600 notched an impressive 4.1% gain last week. Some of that return can be attributed to a “dash for trash” as investors typically look to pick up last year’s relative losers in January. It’s early in the new year, but this could just be the start of a potential sea change as small and mid-cap earnings growth is projected to accelerate in 2026, a fundamental shift that could hit home as smaller capitalization companies post quarterly results and host calls to provide guidance in the coming months. The budding rally in SMid could be stocks discounting this good news, but C-suite confidence could make recent outperformance more durable, and improved economic growth has historically had the greatest impact on smaller companies. Cyclical sectors have played a key role in SMid’s resurgence and market broadening, with consumer discretionary, materials, and industrials leading last week within the S&P 600. The new year has prompted investors to take a closer look into small and midcap stocks, but some of the recent rally could just be performance chasing for a trade, and it’s reasonable to expect some near-term give back after such a torrid start. However, we remain constructive on SMid in ’26 and view any material weakness as a buying opportunity for investors with a 12–18-month time horizon as a number of potential tailwinds are in the offing.
South Korea Still A Standout Performer, But Latin American Equities Are Joining The Rally. Headlines last week were littered with news out of South America with Venezuela and to a lessor degree Colombia taking center stage, but investors appeared to focus more on opportunities amidst the case, bidding up equities tied to Brazil and Colombia. The attention paid to Latin America likely overshadowed the MSCI South Korea index which soared by 6.5% to new highs last week as fourth quarter momentum spilled over into the new year. South Korea’s surge in the past week is a result of resurgent memory storage plays, with Samsung, the largest stock in the MSCI South Korea index, a beneficiary of pricing power and demand in this space. From our perspective, it’s easy to see why global investors are turning their attention towards the tech-rich index as it boasts considerable earnings growth opportunities at a relatively attractive 15.6x forward priceto-earnings ratio. South Korea’s breakout shouldn’t be ignored but given the sharp rally we wouldn’t be surprised if profit taking hits and the KOSPI takes a breather over the near-term.
Bonds: Treasury Yields Steady As The Rise In Sovereign Yields Abroad Pauses; Credit Remains Well Behaved, But Upside Is Increasingly Limited; December Employment Report Not Too Hot, Not Too Cold.
Little Of Note In A Non-Event Week For The Treasury Market As Volatility Remains Subdued. Treasury yields across the curve remained anchored over the balance of last week, with yields on longer-term bonds continuing to bump up against a ceiling of resistance that has held since September. The 10-year Treasury yield started the year at 4.19% and closed last week just 3 basis points lower, continuing what is now a two-plus month streak of subdued volatility in the rates market. However, with the 10-year yield having now spent the entirety of the past month between 4.10% and 4.20% we don’t expect this relative calm to last, and a breakout above 4.20% is likely in the coming months. A break above resistance at 4.20% could lead to an initial move into the 4.35% to 4.40% range. We haven’t seen the 10-year yield above 4.40% since mid-July of last year, so it will be interesting to see how eager investors are to buy long bonds at higher yields or if they initially balk and wait for the 10-year yield to approach the nice round number of 4.50% instead.
Below Investment Grade Credit Valuations Back To ‘Rich’ Levels Seen In February Of 2025. There was no rest for the weary in credit land last week as corporate treasurers sought to take advantage of tighter credit spreads with roughly $10B in new paper coming to market. The surge in issuance is a strong start for those espousing the belief that 2026 will be a record year for corporate issuance. Six Flags and Charter Communications both came to market with issuance that priced towards the tighter end of expectations as demand and investor risk appetite didn’t waver. Option-adjusted spreads (OAS) reflect robust risk appetite as the Bloomberg U.S. Corporate High Yield index fell to its lowest level in nearly eleven months at just 257-basis points over the Treasury curve and sat just 5-bps above a 15-year low last Friday. While spreads could certainly grind tighter, upside price appreciation is limited and the index yield-to-worst is below 6.5% for the first time since April of 2022, decreasing the appeal of some of the riskier pockets of the credit market.
‘Just Right’ December Employment Report Spurs Bond Buying. The December employment report was released last Friday, providing the first timely reading on the labor market from the typical government sources since September. Nonfarm payrolls were expected to rise 70k during the month but fell short of that figure at 50k. Average hourly earnings rose 0.3% month over month and 3.8% year over year, compared to expectations of 0.3% and 3.6%. The unemployment rate was expected to tick lower to 4.5% from 4.6% the prior month, but fell more than expected to 4.4%, while the labor force participation rate came in at 62.4%, in-line with the consensus estimate. There’s something for both doves and hawks on the FOMC to point to in this release to further their cause. Those looking to cut the funds rate in the coming months will point to lackluster payrolls growth of 50k during the month as reason to do so, while those looking to stand pat on rates will highlight the fact that the unemployment rate moved lower to 4.4% during the month. A January cut to the fed funds rate was already viewed as a low likelihood outcome, with fed funds futures placing the probability of a cut at around 13% prior to Friday’s release, and that probability fell to 5% after the payrolls report was disseminated. A pause in January was likely prior to the release, and the case for the FOMC to stand pat is even stronger now.
IMPORTANT DISCLOSURES: THIS PUBLICATION HAS BEEN PREPARED BY THE STAFF OF HIGHLAND ASSOCIATES, INC. FOR DISTRIBUTION TO, AMONG OTHERS, HIGHLAND ASSOCIATES, INC. CLIENTS. HIGHLAND ASSOCIATES IS REGISTERED WITH THE UNITED STATES SECURITY AND EXCHANGE COMMISSION UNDER THE INVESTMENT ADVISORS ACT OF 1940. HIGHLAND ASSOCIATES IS A WHOLLY OWNED SUBSIDIARY OF REGIONS BANK, WHICH IN TURN IS A WHOLLY OWNED SUBSIDIARY OF REGIONS FINANCIAL CORPORATION. RESEARCH SERVICES ARE PROVIDED THROUGH MULTI-ASSET SOLUTIONS, A DEPARTMENT OF THE REGIONS ASSET MANAGEMENT BUSINESS GROUP WITHIN REGIONS BANK. THE INFORMATION AND MATERIAL CONTAINED HEREIN IS PROVIDED SOLELY FOR GENERAL INFORMATION PURPOSES ONLY. TO THE EXTENT THESE MATERIALS REFERENCE REGIONS BANK DATA, SUCH MATERIALS ARE NOT INTENDED TO BE REFLECTIVE OR INDICATIVE OF, AND SHOULD NOT BE RELIED UPON AS, THE RESULTS OF OPERATIONS, FINANCIAL CONDITIONS OR PERFORMANCE OF REGIONS BANK. UNLESS OTHERWISE SPECIFICALLY STATED, ANY VIEWS, OPINIONS, ANALYSES, ESTIMATES AND STRATEGIES, AS THE CASE MAY BE (“VIEWS”), EXPRESSED IN THIS CONTENT ARE THOSE OF THE RESPECTIVE AUTHORS AND SPEAKERS NAMED IN THOSE PIECES AND MAY DIFFER FROM THOSE OF REGIONS BANK AND/OR OTHER REGIONS BANK EMPLOYEES AND AFFILIATES. VIEWS AND ESTIMATES CONSTITUTE OUR JUDGMENT AS OF THE DATE OF THESE MATERIALS, ARE OFTEN BASED ON CURRENT MARKET CONDITIONS, AND ARE SUBJECT TO CHANGE WITHOUT NOTICE. ANY EXAMPLES USED ARE GENERIC, HYPOTHETICAL AND FOR ILLUSTRATION PURPOSES ONLY. ANY PRICES/QUOTES/STATISTICS INCLUDED HAVE BEEN OBTAINED FROM SOURCES BELIEVED TO BE RELIABLE, BUT HIGHLAND ASSOCIATES, INC. DOES NOT WARRANT THEIR COMPLETENESS OR ACCURACY. THIS INFORMATION IN NO WAY CONSTITUTES RESEARCH AND SHOULD NOT BE TREATED AS SUCH. THE VIEWS EXPRESSED HEREIN SHOULD NOT BE CONSTRUED AS INDIVIDUAL INVESTMENT ADVICE FOR ANY PARTICULAR PERSON OR ENTITY AND ARE NOT INTENDED AS RECOMMENDATIONS OF PARTICULAR SECURITIES, FINANCIAL INSTRUMENTS, STRATEGIES OR BANKING SERVICES FOR A PARTICULAR PERSON OR ENTITY. THE NAMES AND MARKS OF OTHER COMPANIES OR THEIR SERVICES OR PRODUCTS MAY BE THE TRADEMARKS OF THEIR OWNERS AND ARE USED ONLY TO IDENTIFY SUCH COMPANIES OR THEIR SERVICES OR PRODUCTS AND NOT TO INDICATE ENDORSEMENT, SPONSORSHIP, OR OWNERSHIP BY REGIONS OR HIGHLAND ASSOCIATES. EMPLOYEES OF HIGHLAND ASSOCIATES, INC., MAY HAVE POSITIONS IN SECURITIES OR THEIR DERIVATIVES THAT MAY BE MENTIONED IN THIS REPORT. ADDITIONALLY, HIGHLAND’S CLIENTS AND COMPANIES AFFILIATED WITH HIGHLAND ASSOCIATES MAY HOLD POSITIONS IN THE MENTIONED COMPANIES IN THEIR PORTFOLIOS OR STRATEGIES. THIS MATERIAL DOES NOT CONSTITUTE AN OFFER OR AN INVITATION BY OR ON BEHALF OF HIGHLAND ASSOCIATES TO ANY PERSON OR ENTITY TO BUY OR SELL ANY SECURITY OR FINANCIAL INSTRUMENT OR ENGAGE IN ANY BANKING SERVICE. NOTHING IN THESE MATERIALS CONSTITUTES INVESTMENT, LEGAL, ACCOUNTING OR TAX ADVICE. NON-DEPOSIT PRODUCTS INCLUDING INVESTMENTS, SECURITIES, MUTUAL FUNDS, INSURANCE PRODUCTS, CRYPTO ASSETS AND ANNUITIES: ARE NOT FDIC-INSURED I ARE NOT A DEPOSIT I MAY GO DOWN IN VALUE I ARE NOT BANK GUARANTEED I ARE NOT INSURED BY ANY FEDERAL GOVERNMENT AGENCY I ARE NOT A CONDITION OF ANY BANKING ACTIVITY.
NEITHER REGIONS BANK NOR REGIONS ASSET MANAGEMENT (COLLECTIVELY, “REGIONS”) ARE REGISTERED MUNICIPAL ADVISORS NOR PROVIDE ADVICE TO MUNICIPAL ENTITIES OR OBLIGATED PERSONS WITH RESPECT TO MUNICIPAL FINANCIAL PRODUCTS OR THE ISSUANCE OF MUNICIPAL SECURITIES (INCLUDING REGARDING THE STRUCTURE, TIMING, TERMS AND SIMILAR MATTERS CONCERNING MUNICIPAL FINANCIAL PRODUCTS OR MUNICIPAL SECURITIES ISSUANCES) OR ENGAGE IN THE SOLICITATION OF MUNICIPAL ENTITIES OR OBLIGATED PERSONS FOR SUCH SERVICES. WITH RESPECT TO THIS PRESENTATION AND ANY OTHER INFORMATION, MATERIALS OR COMMUNICATIONS PROVIDED BY REGIONS, (A) REGIONS IS NOT RECOMMENDING AN ACTION TO ANY MUNICIPAL ENTITY OR OBLIGATED PERSON, (B) REGIONS IS NOT ACTING AS AN ADVISOR TO ANY MUNICIPAL ENTITY OR OBLIGATED PERSON AND DOES NOT OWE A FIDUCIARY DUTY PURSUANT TO SECTION 15B OF THE SECURITIES EXCHANGE ACT OF 1934 TO ANY MUNICIPAL ENTITY OR OBLIGATED PERSON WITH RESPECT TO SUCH PRESENTATION, INFORMATION, MATERIALS OR COMMUNICATIONS, (C) REGIONS IS ACTING FOR ITS OWN INTERESTS, AND (D) YOU SHOULD DISCUSS THIS PRESENTATION AND ANY SUCH OTHER INFORMATION, MATERIALS OR COMMUNICATIONS WITH ANY AND ALL INTERNAL AND EXTERNAL ADVISORS AND EXPERTS THAT YOU DEEM APPROPRIATE BEFORE ACTING ON THIS PRESENTATION OR ANY SUCH OTHER INFORMATION, MATERIALS OR COMMUNICATIONS.
SOURCE: BLOOMBERG INDEX SERVICES LIMITED. BLOOMBERG® IS A TRADEMARK AND SERVICE MARK OF BLOOMBERG FINANCE L.P. AND ITS AFFILIATES (COLLECTIVELY “BLOOMBERG”). BARCLAYS® IS A TRADEMARK AND SERVICE MARK OF BARCLAYS BANK PLC (COLLECTIVELY WITH ITS AFFILIATES, “BARCLAYS”), USED UNDER LICENSE. BLOOMBERG OR BLOOMBERG’S LICENSORS, INCLUDING BARCLAYS, OWN ALL PROPRIETARY RIGHTS IN THE BLOOMBERG BARCLAYS INDICES. NEITHER BLOOMBERG NOR BARCLAYS APPROVES OR ENDORSES THIS MATERIAL OR GUARANTEES THE ACCURACY OR COMPLETENESS OF ANY INFORMATION HEREIN, OR MAKES ANY WARRANTY, EXPRESS OR IMPLIED, AS TO THE RESULTS TO BE OBTAINED THEREFROM AND, TO THE MAXIMUM EXTENT ALLOWED BY LAW, NEITHER SHALL HAVE ANY LIABILITY OR RESPONSIBILITY FOR INJURY OR DAMAGES ARISING IN CONNECTION THEREWITH.