
Download Asset Allocation | November 2025
One Headlight
After the excitement and confusion of October, November enters with clarity. After 44 days, the longest U.S. government shutdown in history has ended, and the flow of economic data is expected to resume in the second half of the month. However, incremental data and messaging from the FED now suggests a December rate cut has a probability roughly equivalent to that of a coin flip. There’s got to be something better than in the middle. In the absence of data, bad news was good news as many equity markets (and surprisingly gold and silver) made new all-time highs in October. In the 27 weeks following April 21st the S&P 500 advanced just under 40% without a 10% pullback, but nothing lasts forever. Will the resumption of data or a less dovish FED end the unrelenting streak of the “everything rally”? Will the leaves fall with equity market prices into year end? Or will markets continue forward, ever closer, to the end of another year with record gains?
Economic Update
Path Ahead Remains Far from Clear
Regions Economic Division
As we discussed in last month’s edition, the shutdown came at a time when assessments of the state of the U.S. economy and its path forward were all over the map and FOMC members seemed increasingly at odds over the appropriate path of monetary policy. These divides seem to have sharpened over the course of the shutdown, which would be expected given the lack of data which would help settle these questions. To be sure, even in “normal” times there are always differences of opinion on where the economy is and where it is heading but a consensus view emerges from these differences and, while not always on the mark, at least serves as an anchor for analysts, policy makers, and market participants. Absent such an anchor, these differences in views seem starker and, the longer the shutdown persists, more intractable.
On the whole, the information at our disposal suggests an economy that remains resilient despite the many obstacles lining its path. For instance, though not fully concluded as of this writing, the Q3 earnings season was notably strong, with sizable majorities of firms beating on the top and bottom lines. These beats were broadly based across industry groups and guidance was fairly constructive amid what remains heightened uncertainty. There are some outliers, such as housing, but the Q3 earnings season is consistent with where we were tracking Q3 real GDP growth before the shutdown significantly curtailed the flow of economic data. Based on the data available up to that point, we had been tracking Q3 real GDP growth at an annual rate of around 3.5%, not far off the 3.8% growth rate logged in Q2, with consumer spending and business investment tracking stronger than we had previously anticipated.
Had it been released on October 3 as originally scheduled, the September employment report may have been celebrated, even if not with all that much enthusiasm. Instead, having been released November 20th thanks to the government shutdown, the September employment report is being given the cold shoulder because, after all, September was a long time ago, though we suspect many of those brushing it aside would be reacting differently given a meaningfully worse headline print. Either way, total nonfarm payrolls rose by 119,000 jobs in September, with private sector payrolls up by 97,000 jobs and public sector payrolls up by 22,000 jobs. Our forecast, which we originally printed on September 29, anticipated an increase of 102,000 jobs with private sector payrolls up by 94,000 jobs and public sector payrolls rising by 8,000 jobs, while the consensus forecast anticipated the headline print showing a gain of 50,000 jobs. Prior estimates of job growth in July and August were revised down by a net 33,000 jobs for the two-month period, with the revised data now showing nonfarm payrolls declined by 4,000 jobs in August as a drop in public sector payrolls more than negated a middling increase in private sector payrolls. The unemployment rate rose to 4.4% in September on a jump in labor force participation which we do not find to be at all credible given that it is more than entirely accounted for by those in the 16-to-24-year-old age cohort. The broader U6 measure, which also accounts for underemployment, ticked down to 8.0% from 8.1% in August on a decline in the number of those working part-time for economic reasons. Average hourly earnings rose by 0.2%, matching our below-consensus forecast, leaving them up 3.8% year-on-year. But, the average length of the workweek held at 34.2 hours, thus dampening growth in private sector wage and salary earnings, which were up 0.3% in September and were up 4.7% year-on-year.
Though many are dismissing it out of hand, here’s how we interpret the September employment report. The economy clearly had lost momentum during the summer, which we noted at the time. But, we also had pointed to what looked to have been reacceleration in activity over late-August into September, pushing back against what had become a rather dour outlook on growth in some corners. Indeed, we’re looking for real GDP to have grown at an annual rate of around 4.0% in Q3, and the September employment report would be consistent with our premise. Moreover, job growth was notably more broadly based in September, with the one-month hiring diffusion index, a measure of the breadth of job growth across private sector industry groups, rising to 55.6% after having been below the 50% line in both July and August, indicating that on net a higher percentage of industry groups were shedding jobs rather than adding jobs. The bounce in September is also consistent with our premise. To be sure, we don’t have a good handle on what’s transpired since then, and the shutdown will have had an impact. But jobless claims remain well-behaved and are not signaling growing stress in the labor market. At the least, the “low hire-low fire” characterization of the labor market seems to still be holding.
We did, and continue to, expect some payback in the Q4 data. For instance, as reported by Autodata, unit motor vehicle sales averaged 16.7 million units in Q3, with sales in August and September boosted by consumers acting to beat the expiration of EV tax credits at the end of September, and it seemed all but a given that the October data would show payback. That was indeed the case, with Autodata reporting unit sales of new motor vehicles at an annual rate of 15.5 million units, all but assuring that vehicle purchases will be a drag on Q4 growth in real consumer spending. Note that the Bureau of Economic Analysis BEA is the source of estimates on motor vehicle sales in the GDP data, but the Autodata series tends to track the BEA’s series, making this one example of private sector data filling the void in the public sector data.
The shutdown will also weigh on Q4 real GDP growth. For instance, even though furloughed government workers will receive back pay, BEA deducts the lost output of these workers from its estimate of federal government consumption/investment over the course of a shutdown and does not add that back once the shutdown is over. This will be a meaningful drag on federal government spending in the Q4 GDP data. There will also be a hit to private sector output/spending stemming from the shutdown, and while much of this will subsequently be made up for, that the shutdown has extended into November means the deduction from Q4 activity likely won’t be fully reversed in the data until Q1 2026.
The ISM Manufacturing Index slipped to 48.7% in October, marking the eight straight month and the thirty-fourth of the past thirty-six months in which the headline index has been on the wrong side of the 50.0% break between contraction and expansion. The reality, however, is that the headline index has been little changed over most of this longer period, bouncing within a fairly narrow range, which has been the case with most of the component indexes beneath the headline number. Survey respondents continue to express frustration with what seems a constantly shifting tariff regime that is weighing on orders and causing uncertainty over pricing of both inputs to production and finished goods. In contrast, the ISM Non-Manufacturing Index rose to 52.4% in October, signaling a faster pace of expansion in the broad services sector with the headline index bolstered by a jump in the new orders index.
For several months prior to the shutdown the labor market had been characterized as a “low hire-low fire” labor market, and we have consistently made two points. First, the slowing trend rate of job growth is far more a reflection of a lower rate of hiring than a rising pace of layoffs and, second, the lower rate of hiring has been far more a labor supply story than a labor demand story. The various private sector indicators suggest the “low hire” aspect continued in October. For instance, payroll processing firm Automatic Data Processing (ADP) reports private sector payrolls rose by 42,000 jobs in October. While perhaps not inspiring much confidence, this is not far from where we and many others put the estimate of “breakeven” job growth, i.e., monthly job growth required to keep the unemployment rate steady, given what is now a much slower pace of growth in the labor force.
The weekly data on initial claims for unemployment insurance suggest, recent headlines notwithstanding, the “low fire” aspect also remains intact. The not seasonally adjusted data continue to exhibit typical seasonal patterns, and claims continue to hover a bit below the trend rate that prevailed prior to the pandemic. To be sure, enhanced labor productivity stemming from adoption of AI, uncertainty over trade policy, and firms continuing to push for operating efficiency may hold down job growth and/or contribute to rising layoffs going forward. Any such effects, however, should not be conflated with a structural downshift in the pace of hiring stemming from markedly slower labor force growth.
Growing concerns over downside risks to the labor market come amid lingering upside inflation risks stubbornly above the FOMC’s 2.0% target rate. The September Consumer Price Index (CPI) shows both headlines and core inflation at 3.0%. Perhaps somewhat ominously, the September CPI data shows further acceleration in core (non-food, non-energy) goods price inflation, which to some extent reflects further tariff pass-through. We’ve maintained that tariff pass-through would be more of a gradual build rather than an all-at-once wave and continue to think tariff pass-through will become more pronounced in the new year.
Several FOMC members remain more focused on the upside risks to inflation than on the downside risks to the labor market. This was apparent in Chair Powell’s press conference following the October FOMC meeting, a meeting in which the Committee cut the Fed funds rate by twenty-five basis points. Chair Powell stressed that an additional funds rate at the December FOMC meeting was “not a foregone conclusion – far from it,” while noting a growing number of members thought a pause might be appropriate. Our sense is that if the data continues to show the labor market stabilizing around a low pace of hiring and a low pace of layoffs amid continued upside risks to inflation, the FOMC may indeed pass on a December rate cut. To the extent the shutdown endures and continues to constrict the flow of economic data, the risk of a policy misstep increases.
Sources: Bureau of Economic Analysis; Bureau of Labor Statistics; Institute for Supply Management, AutoData; ADP National Employment Report
Investment Strategy Update
Regions Multi-Asset Solutions & Highland Associates
From a fundamental perspective, corporate earnings and guidance are supportive of upside into year-end after 82% of S&P 500 companies that have posted quarterly results topped the consensus estimate for earnings per share, with an average ‘beat’ of 6.7%. Encouragingly, almost two-thirds of the S&P 500 companies that have reported also bested the consensus estimate for sales as well. The consensus estimate for S&P 500 earnings per share (EPS) in 3Q25 has jumped from $67.68 at the end of September to $71.23 at the end of October as a result, providing a boost to investor sentiment. Since bottoming in mid-May, revisions to S&P 500 EPS estimates in both 2026 and 2027 have been decidedly positive and the consensus estimate for S&P 500 EPS in 2026 is now $306, up from $302.62 at the end of September implying over 13% year over year earnings growth, while 2027 EPS is estimated to be $342, up from $335 at the end of September. While valuations are lofty, with the S&P 500 trading at 22.5 times estimated 2026 earnings, positive earnings revisions should be supportive of prices into year-end, and potential drivers of upside don’t stop there.
Beyond the ‘good cheer’ the holiday season typically elicits and the positive earnings backdrop, less restrictive monetary policy, subsiding trade uncertainty, stable Treasury yields, the reopening of the corporate stock buyback window, and mergers and acquisitions (M&A) activity ramping up are a handful of additional drivers of our constructive outlook into year-end. Share buybacks and an uptick in M&A activity are two potential drivers of positive sentiment worth digging deeper into, while most of the others are simply an absence of things that would otherwise be cited as cause for concern and bricks in the wall of worry for market participants.
On the M&A front, deal making activity has picked up noticeably in recent months and announced North America transaction volume has totaled $2.7T this year, a 63% increase year over year. On earnings calls, investment banks were universally constructive on the M&A pipeline into 2026, and with little/no pushback from the Department of Justice and Federal Trade Commission on announced combinations up to this point, we could see larger transformative deals in the coming quarters, not just the smaller bolt-on transactions that were less likely to garner scrutiny from regulators that we grew accustomed to in recent years. Corporations playing offense and engaging in M&A take confidence, and if the share price of acquiring firms responds positively to deal announcements that could embolden others considering such a move to enter the fray. The hottest themes in both public and private markets this year continue to be AI and related beneficiaries. Google’s acquisition of Wiz and HP’s acquisition of Juniper are among the largest in this category, but we have begun to see a new generation of private equity strategies that bridge the gap between venture and buyout. Paradoxically, some venture funding rounds are being used for acquisitions of old economy businesses. These start-ups are buying call centers, accounting firms, and other businesses in an attempt to disrupt, rather than sell into, these industries. Many buyout strategies have also begun to use AI or technology to convert service-based businesses into tech-enabled platforms.
As anticipated,the FOMC delivered another Fed funds rate cut in October and announced the end of quantitative tightening. What was not anticipated, however, was the hawkish tone taken by Chair Powell in his post-meeting press conference, which stifled optimism surrounding a December rate cut and soured investor sentiment on U.S. small and mid-cap stocks. Another pause in the easing cycle is an undeniable speed bump for smaller companies, but macro forces notwithstanding, fundamentals are improving. Despite sizable beats of 8.6% to consensus earnings so far this quarter, the Russell Midcap trades at just 18 times forward earnings, well below the 25.4 multiple for the Russell 1000, which has similar earnings growth projections. A valuation discount of this magnitude seems unwarranted, even if the path forward for earnings and monetary policy is murkier than it appeared to be a few months back. A more durable turnaround in could be in the cards for smaller companies in 2026, but weaker labor data could lead the FOMC to deliver a rate cut next month and draw investors back into this embattled sub-asset class, even if just for a trade, into year-end.
Positive Earnings Surprises Out Of Midcaps Going Largely Unnoticed (Aggregate % Surprise)
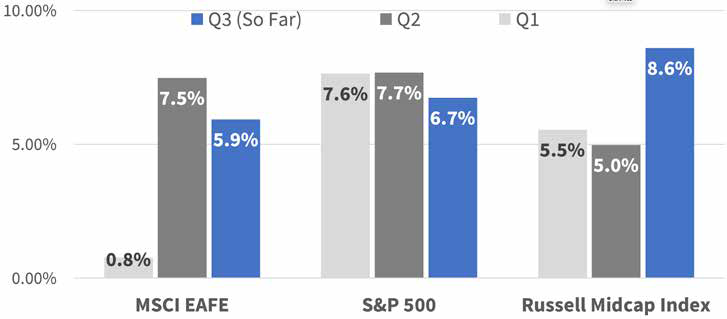
Source: Bloomberg
International indices have outperformed U.S. indices this year, but dollar strength against developed currencies may be a headwind for developed international indices. The MSCI ACWI outperformed this year, with the MSCI EAFE and MSCI Emerging Markets (EM) indices higher by 27.2% and 33.5%, respectively, through October. U.S. dollar weakness provided a tailwind for foreign markets throughout much of this year, but the greenback has found its footing after bottoming on September 16 and the U.S. Dollar index (DXY) has since risen over 3% since.
Emerging markets continue to outperform developed markets, but the S&P has trailed by less than the MSCI EAFE. Despite dollar strength from September 16 through market close on November 6, the MSCI EM gained 3.3% while the S&P 500 posted a 3.0% return. Over this time, the MSCI EAFE index returned just 0.3% on a total return basis.
Developed Asia has propped up developed market indices with a 22% weight in Japanese equities. Japan’s Nikkei 225 index jumped 6.9% since mid-September, as the country’s export heavy economy benefits from weakness in the Japanese yen up to a certain point. Should the yen continue to slide versus the U.S. dollar, however, the Bank of Japan might be forced to hike rates to support the currency, potentially leading to a positioning and sentiment shakeout for Japanese stocks in the new year. Investors in developed market indices abroad should be aware of narrowing leadership since DXY’s September bottom, as Japan’s strength has masked lackluster performance out of exposures to Australia, France, Germany, Italy, and Switzerland, with these five countries accounting for 38% of the EAFE index.
U.S. Dollar Has Firmed Since Mid-September:
Range Bound, Or Breakout Above The 200 Day Incoming?
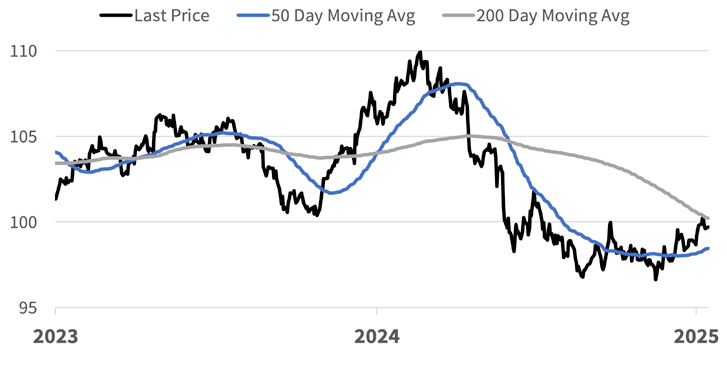
Source: Bloomberg
After a lull, interest rate volatility could ramp up into year-end.Treasury yields bounced at month-end as Fed Chair Powell took a surprisingly hawkish tone in his prepared post-meeting remarks, stressing that a rate cut in December was far from a done deal. The FOMC delivered on the market’s expectations by cutting the funds rate and announced it would cease running down the size of its balance sheet on December 1st, but volatility crept back into the rates market as the path forward for monetary policy suddenly became more uncertain. Treasury yields across the curve rose after Chair Powell’s remarks as market participants downgraded their expectations of a December rate cut, with Fed funds futures shifting from pricing in a 98% likelihood of a December cut prior to the meeting to an approximate 67% probability in the aftermath of the press conference.
For the benchmark 10-year yield, 3.95% is the level worth watching on the downside as a break below could bring last September’s low around 3.60% into play. However, a move of this magnitude is unlikely; with inflation remaining stuck at 3% and GDP growth estimates for the 3rd quarter running around 3.5%, investors will likely balk at buying longer duration bonds should yields fall much below current levels. A move back above 4.20% is a more likely path for the 10-year yield in the coming months given our outlook for economic growth and inflation in the coming year, but the 10-year yield could encounter resistance in the 4.50% to 4.60% zone as buyers appeared willing to step in around those levels earlier this year.
Into year-end, we expect volatility in the rates market to pick up after a multi-month lull as fixed income investors recalibrate their expectations surrounding the state of the U.S. labor market and path forward for the Fed funds rate once the U.S. government reopens. With Treasury yields likely to trend higher in the coming months and credit spreads historically tight, very little appears cheap, and our portfolios remain in-line with strategic long-term target allocations as we wait for dislocations to present tactical opportunities to adjust positioning.
Credit markets reprice risk, but valuations are not yet attractive enough to add exposure. Investment grade (IG) and high yield credit both got cheaper in October as concerns around a prolonged government shutdown and recent credit events prompted market participants to reprice risk assets. A string of high-profile bankruptcies in October, specifically auto parts maker First Brands Group and subprime lender TriColor Holdings, put market participants on edge and called into question whether historically tight spreads remained warranted. The Bloomberg High Yield index began October with a credit spread of around 270 basis points over the U.S. Treasury curve but was closer to 294 basis points in early November. To put those numbers into perspective, the option-adjusted spread (OAS) for the index hasn’t reached 300 basis points since June after getting as high as 450 basis points after the April tariff announcement.
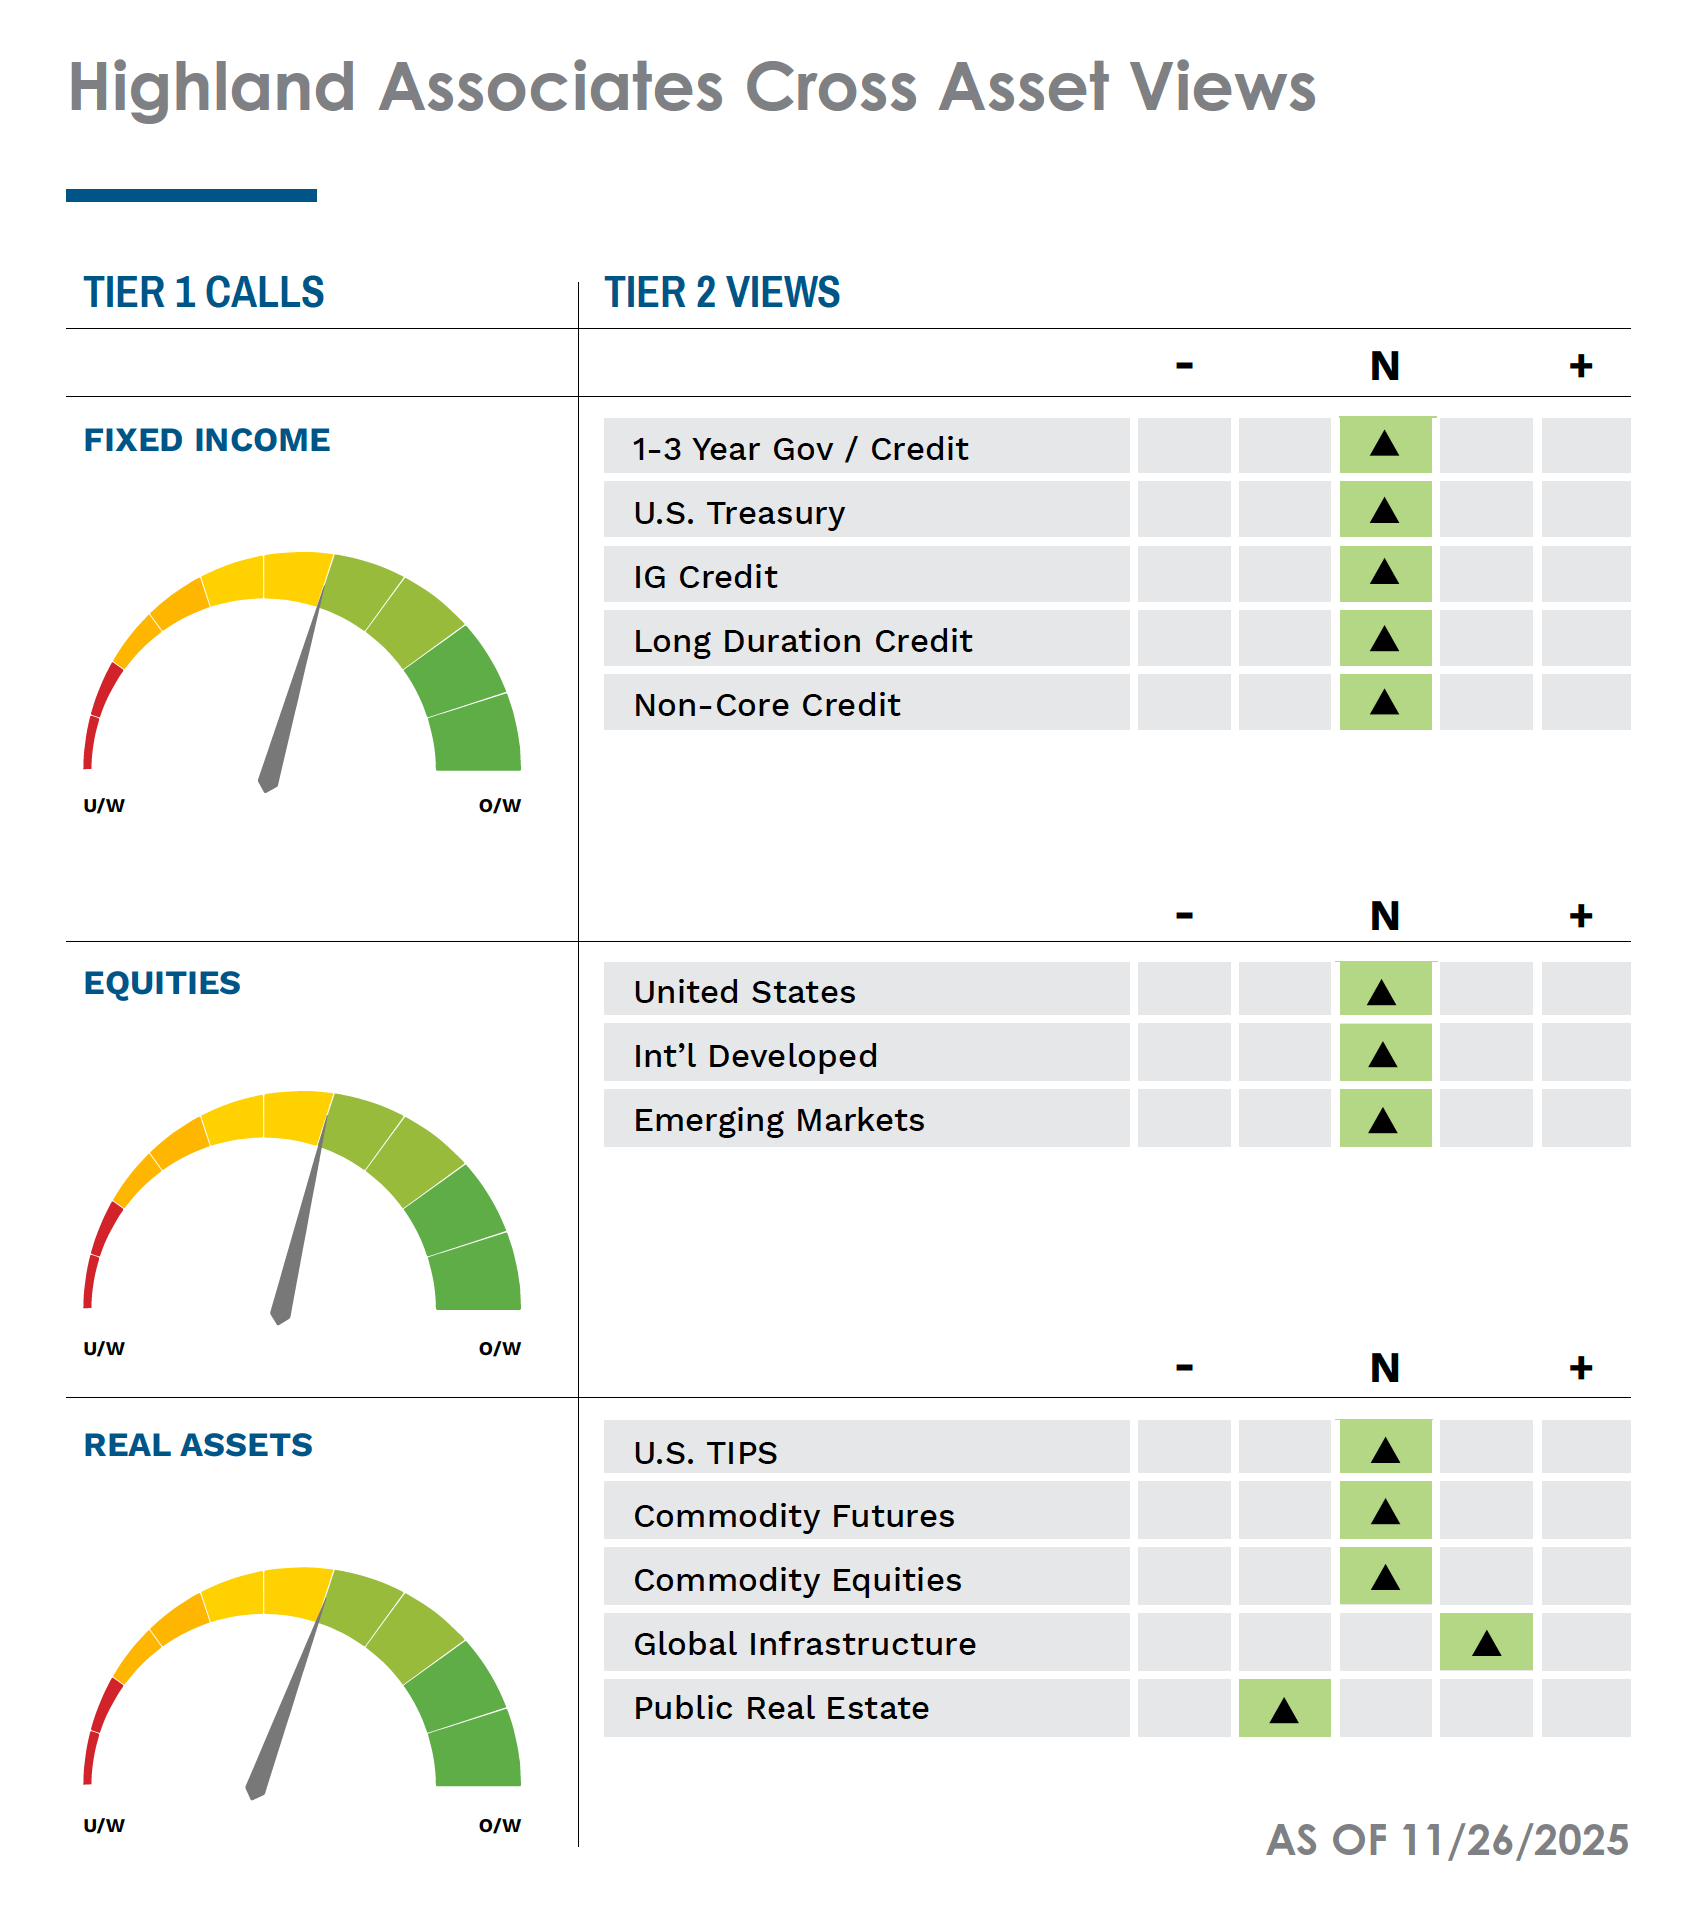
These dynamics lead us to believe there is less upside in fixed income markets over the near-term. From a positioning standpoint, Highland remains relatively neutral to the Bloomberg US Aggregate from a duration and curve positioning standpoint. Our portfolios currently have an underweight exposure to US Treasuries, while remaining overweight to higher spread areas like corporates and securitized products.
We believe that emerging market equities could continue to outperform domestic and international developed equities over the near-term as EM central banks consider potential monetary easing from their current restrictive positions. Additionally, valuations remain more attractive in these countries and potential earnings growth is higher than in other regions. With that as a backdrop, Highland has moved to an overweight to Emerging Market equities from our long-held neutral stance to the MSCI ACWI Index. From a sector view, we continue to believe that natural resource equities and listed infrastructure companies will be other beneficiaries of the AI boom and have increased the allocation to those assets within our inflation-sensitive portfolio. We are also cautious of US large-cap equities after 77% of the market capitalization growth of the S&P 500 was driven by 41 companies in the 2nd quarter and 3rd quarter of 2025. We have seen the S&P 500 outperform the equal-weighted S&P 500 by ~7.2% year-to-date, and we anticipate some potential retracement in the coming months.
IMPORTANT DISCLOSURES: This publication has been prepared by the staff of Highland Associates, Inc. for distribution to, among others, Highland Associates, Inc. clients. Highland Associates is registered with the United States Security and Exchange Commission under the Investment Advisors Act of 1940. Highland Associates is a wholly owned subsidiary of Regions Bank, which in turn is a wholly owned subsidiary of Regions Financial Corporation. Research services are provided through Multi-Asset Solutions, a department of the Regions Asset Management business group within Regions Bank. The information and material contained herein is provided solely for general information purposes only. To the extent these materials reference Regions Bank data, such materials are not intended to be reflective or indicative of, and should not be relied upon as, the results of operations, financial conditions or performance of Regions Bank. Unless otherwise specifically stated, any views, opinions, analyses, estimates and strategies, as the case may be (“views”), expressed in this content are those of the respective authors and speakers named in those pieces and may differ from those of Regions Bank and/or other Regions Bank employees and affiliates. Views and estimates constitute our judgment as of the date of these materials, are often based on current market conditions, and are subject to change without notice. Any examples used are generic, hypothetical and for illustration purposes only. Any prices/quotes/statistics included have been obtained from sources believed to be reliable, but Highland Associates, Inc. does not warrant their completeness or accuracy. This information in no way constitutes research and should not be treated as such. The views expressed herein should not be construed as individual investment advice for any particular person or entity and are not intended as recommendations of particular securities, financial instruments, strategies or banking services for a particular person or entity. The names and marks of other companies or their services or products may be the trademarks of their owners and are used only to identify such companies or their services or products and not to indicate endorsement, sponsorship, or ownership by Regions or Highland Associates. Employees of Highland Associates, Inc., may have positions in securities or their derivatives that may be mentioned in this report. Additionally, Highland’s clients and companies affiliated with Highland Associates may hold positions in the mentioned companies in their portfolios or strategies. This material does not constitute an offer or an invitation by or on behalf of Highland Associates to any person or entity to buy or sell any security or financial instrument or engage in any banking service. Nothing in these materials constitutes investment, legal, accounting or tax advice. Non-deposit products including investments, securities, mutual funds, insurance products, crypto assets and annuities: Are Not FDIC-Insured I Are Not a Deposit I May Go Down in Value I Are Not Bank Guaranteed I Are Not Insured by Any Federal Government Agency I Are Not a Condition of Any Banking Activity.
Neither Regions Bank nor Regions Asset Management (collectively, “Regions”) are registered municipal advisors nor provide advice to municipal entities or obligated persons with respect to municipal financial products or the issuance of municipal securities (including regarding the structure, timing, terms and similar matters concerning municipal financial products or municipal securities issuances) or engage in the solicitation of municipal entities or obligated persons for such services. With respect to this presentation and any other information, materials or communications provided by Regions, (a) Regions is not recommending an action to any municipal entity or obligated person, (b) Regions is not acting as an advisor to any municipal entity or obligated person and does not owe a fiduciary duty pursuant to Section 15B of the Securities Exchange Act of 1934 to any municipal entity or obligated person with respect to such presentation, information, materials or communications, (c) Regions is acting for its own interests, and (d) you should discuss this presentation and any such other information, materials or communications with any and all internal and external advisors and experts that you deem appropriate before acting on this presentation or any such other information, materials or communications.
Source: Bloomberg Index Services Limited. BLOOMBERG® is a trademark and service mark of Bloomberg Finance L.P. and its affiliates (collectively “Bloomberg”). BARCLAYS® is a trademark and service mark of Barclays Bank Plc (collectively with its affiliates, “Barclays”), used under license. Bloomberg or Bloomberg’s licensors, including Barclays, own all proprietary rights in the Bloomberg Barclays Indices. Neither Bloomberg nor Barclays approves or endorses this material or guarantees the accuracy or completeness of any information herein, or makes any warranty, express or implied, as to the results to be obtained therefrom and, to the maximum extent allowed by law, neither shall have any liability or responsibility for injury or damages arising in connection therewith.