
Download Asset Allocation | June 2025
Everybody Wants to Rule the World
Economic Update
Tariff Concerns Dominate
By Regions Economic Division
Like the temperature, equity markets have continued their steady climb higher this June. The looming specter of tariffs has yet to ignite inflationary pressures or stifle economic activity. Markets have greeted the 90-day tariff pause with relief, but as a “Tears for Fears” lyric once suggested, nothing lasts forever. With less than three weeks remaining before the pause expires, only a solitary trade agreement in place (with the UK) has been announced. Increasingly speculation mounts that the prevailing 10% tariffs on all imports, alongside steeper duties on select imports, may be the status quo at the conclusion of the tariff hiatus.
Beneath the surface of calmer markets, domestic and global frictions dominate headlines. Conflict has erupted between Iran and Israel causing oil prices to surge more than 17% between the month’s outset and the time of this writing. Falling oil prices have kept inflation in check thus far, but trade and geopolitical tensions may cause this streak to end. Bulls have retained their grip on markets amidst these fractures. Will equity markets continue their march higher? Or will mounting social and geopolitical unrest weaken the bullish resolve? After all, everybody wants to rule the world.
Another month in, U.S. businesses and consumers seem no closer to having clarity on the trade front. The economic data continue to be swayed by developments on the trade policy front, with sudden and sizable changes having become the norm. Roughly thirty days away from the end of the first ninety-day pause in implementation of the most punitive tariffs announced on April 2, the absence of finalized trade deals adds another layer of uncertainty. The economic data continue to send mixed signals, and the financial markets will likely remain somewhat volatile.
Based on revised and more complete source data, the Bureau of Economic Analysis (BEA) now estimates real GDP contracted at an annual rate of 0.2% in Q1 2025, little changed from the initial estimate of 0.3% and substantially smaller than the typical revision between the BEA’s first and second estimates of real GDP growth in any given quarter. Additionally, the details show sizable revisions in several of the underlying components that, while leaving the headline growth print little changed, yielded a larger revision to the initial estimate of real private domestic demand – combined business and household spending adjusted for price changes. The BEA’s second estimate puts annualized Q1 growth in real private domestic demand at 2.5% rather than the initial estimate of 3.0%.
There was a sharp downward revision to the initial estimate of growth in real consumer spending and an upward revision to the initial estimate of imports of goods, which would have yielded a larger contraction in real GDP than first estimated. The offsets, however, came from meaningful upward revisions to business investment and inventory accumulation, along with a modest revision to government spending – the latter two of which do not enter into real private domestic demand, hence the larger revision than was the case for top-line real GDP growth. Revisions notwithstanding, the two main takeaways from the Q1 GDP data remain the same. First, in the early months of 2025, businesses and households reacted strongly to anticipated increases in tariffs, which sets up payback over coming quarters. Second, the economy is neither as troubled as implied by the contraction in real GDP nor as robust as implied by the growth in real private domestic demand seen in the Q1 data.
To the first point, we are already seeing clear signs of payback across several data series. For instance, sales of new motor vehicles fell sharply in May after having leapt to the highest monthly sales rates in over four years in March and April. Though not to the same extent, spending on other types of consumer durable goods – appliances, furniture, electronics – has exhibited similar patterns, setting up consumer durable goods to be a meaningful drag on overall consumer spending in the months ahead. After a surge in business investment acted as a strong support for real GDP in Q1, orders for core capital goods, which foreshadow the GDP data on business investment in equipment and machinery, plummeted in April to an extent that virtually locks in a decline for Q2 as a whole. A significantly slower pace of inventory accumulation will also weigh on Q2 real GDP growth. Conversely, imports of goods into the U.S. fell by 19.9% in April and a further, albeit less severe, decline is likely in May. As such, even if the temporary trade truce between the U.S. and China leads to higher import volumes in June, the Q2 data will show a sharp decline in goods imports. In keeping with GDP accounting conventions, this decline will act as a powerful boost to Q2 real GDP, which we now anticipate will come in at an annual rate of over 2% even as real private domestic demand virtually flatlines.
The May surveys by the Institute for Supply Management (ISM) offer further evidence of uncertainty over trade policy weighing on economic activity. Both the ISM Manufacturing Index and the ISM Non-Manufacturing Index were on the wrong side of the 50.0% break between contraction and expansion in May. The former was not surprising, but the latter was as a steep decline in new orders which pushed the gauge of service sector activity down to 49.9%. Still, most components of the ISM Non-Manufacturing Index signal growth, albeit at a slower pace, in the services sector. In contrast, activity in the manufacturing sector has slowed significantly as evidenced by contractions in new orders, production, and employment. One thing that continues to stand out in both ISM surveys, however, is that upward pressure on input prices remains intense, in part a reflection of higher tariffs, which does not bode well for inflation returning to the FOMC’s 2.0% target any time soon.
Though the labor market continues to hold up better than many had anticipated, the May employment report, nonetheless, contains some worrisome signs. Total nonfarm payrolls rose by 139,000 jobs in May, and while that was better than admittedly low expectations, prior estimates of job growth in March and April were revised down by a net 95,000 jobs for the two-month period. This extends a long run of downward revisions to the initial estimates of monthly job growth, which is a pattern typically seen in times of slowing growth, or outright declines, in nonfarm payrolls. At the same time, private sector job growth has become notably less broadly based. In May, the one-month hiring diffusion index, a measure of the breadth of hiring across private sector industry groups, fell to 50.0% which, barring July 2024 (when impacted by Hurricane Beryl), is the lowest reading since the onset of the pandemic. We attach much significance to the hiring diffusion index, our premise being that narrowly based private sector job growth is more susceptible to an adverse shock.
While the unemployment rate held at 4.2% in May, both the size of the labor force and the level of household employment dropped by over 600,000 persons. Moreover, barring the immediate aftermath of the pandemic, May saw the highest number of people transition from being employed to being out of the labor force in any month on record. Though the household survey data is inherently volatile, the changes in these metrics in May were abnormally large and these metrics bear watching in the months ahead. Another development we think merits attention is declining labor force participation amongst foreign born persons thus far in 2025. Through May, the decline in foreign born employment from January was larger than the decline in the foreign-born population over this same span. To the extent rapidly rising foreign born participation fueled notably rapid labor supply growth over the 2022-2024 period, allowing for strong growth in nonfarm employment, declining foreign born participation is at present likely acting as a drag on job growth.
Clearly, the demand for labor continues to cool, but it is important to note that thus far what has been a slowing trend rate of job growth is a function of a slowing rate of hiring as opposed to a rising rate of layoffs. Moreover, thus far, there are no signs of firms altering hours worked as a means of managing total labor input. Around cyclical turning points, firms will tend to vary hours worked as they assess whether rising/falling demand will be sustained, and it is only after they have made such assessments that they become more aggressive in adding/reducing the number of workers they employ. Given signs of softening demand and concern around the potential impacts of trade disputes, it would not have been surprising had firms begun cutting back on hours as an alternative to layoffs. That has not yet been the case, but we will be watching for signs of this changing.
In short, while there are causes for concern in the labor market data, there is no evidence that the labor market is on the verge of rolling over. Absent such evidence, the FOMC will be inclined to remain on the sidelines, particularly amid concerns that higher tariffs will add to inflation pressures in the months ahead. Meanwhile, the path of longer-term interest rates will be largely driven by the outlook for economic growth, concerns over the U.S. fiscal path, and international capital flows. With the economic data likely to remain somewhat volatile amid an uncertain outlook for trade policy, we could continue to see sharp swings in equity prices and interest rates in the weeks/months ahead.
Sources: U.S. Bureau of Economic Analysis; U.S. Bureau of Labor Statistics; Institute for Supply Management
Investment Strategy Update
Regions Multi-Asset Solutions & Highland Associates
U.S. equity indices built on April’s positive price momentum with the S&P 500 gaining 6.1% in May on its way to a 1% year-to-date total return. The S&P Midcap 400 and S&P Small Cap 600 returned 5.2% and 5%, respectively, in May, but both indices remain in negative territory for 2025. The popular market adage of “sell in May and go away” again proved to be a clever rhyme rather than sound investment advice as the S&P 500 turned out its sixth consecutive gain during the month of May and closed higher for the ninth time in the past ten years. From a seasonal perspective, the good times for U.S. stocks could continue to roll as the S&P 500 has fared quite well in the months of June and July over the past decade. The bulls have the wind at their sails with breadth, momentum, and seasonality all pointing toward additional upside in the coming months, but complacency is a risk as volatility can ramp-up on a moment’s notice in headline-driven market environments.
After bottoming intra-day around 4,850 on April 9, the S&P 500 has rebounded 22% at the time of this writing, outpacing respectable 20% and 18% returns from the S&P Midcap 400 and S&P Small Cap 600 over the same time frame. The broad-based recovery for U.S. stocks off the lows seen in early April has been impressive, and investors have been handsomely compensated for shrugging off trade-related headlines and buying the dip as the U.S. economy has proven resilient and shrugged off consumer confidence readings that have fallen somewhere between sour and dire in recent months. But with the S&P 500 trading at 22.4 times projected 2025 earnings and 20 times expected 2026 earnings, the bar to chin is once again elevated and an improved economic outlook and/or an uptick in earnings estimates – not just signs of stabilization – may be required to drive meaningful near-term upside for U.S. large cap stocks.
With the 90-day pause on U.S. ‘reciprocal’ tariffs expiring July 9 and the Trump administration requesting “best offers” from trading partners earlier this month, the coming month(s) will present investors with a daily dose of potentially market moving headlines as deals are announced, deadlines are extended, or saber-rattling ramps up as a negotiating tactic. The U.S. coming to terms with trade partners such as Australia, India, Japan, South Korea, and/or others in the near-term could spur investors hiding out in short-dated Treasuries and underexposed to stocks to put some of that dry powder to work, but a further easing of tensions with China could lead to a wholesale re-risking. The pause on reciprocal tariffs on Chinese imports expires in August, giving the two parties a few more months to work out a deal, and so long as each side plays nice saying the right things, the S&P 500 could retest February’s highs on ‘no news.’
The longer the S&P 500 remains above its 200-day moving average which sits just below 5,800, hedge funds that sat out the rally will face increased pressure to play catch-up, a potentially powerful driver of further upside for U.S. large cap stocks. Also worth watching, while systematic trend following strategies have been adding to equity exposure over the past month, these managers may also be emboldened to press bets. While we remain relatively constructive on the outlook for U.S. equities in the near-term, with the S&P 500 again trading at stretched valuations after rallying in April and May, investors may be well served to look for opportunities in lagging areas such as U.S. small- and mid-cap (SMid) stocks to supplement higher quality ‘core’ exposures to U.S. large caps.
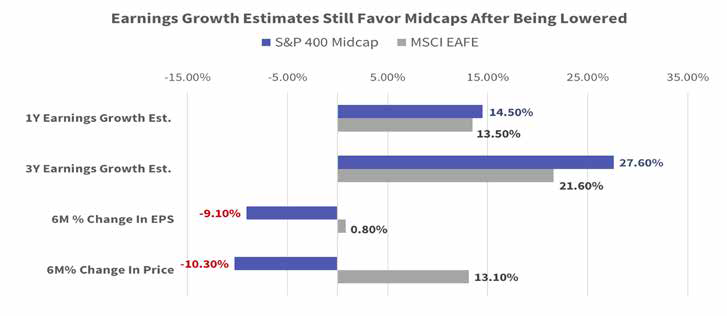
U.S. mid-caps present an attractive risk/reward versus developed market stocks. U.S. mid-cap stocks have largely been ignored over the past year, particularly in the past six months, as concerns around margin pressures stemming from tariffs and sustained higher interest rates have pulled the S&P Midcap 400 down by 9.5% since the end of November. Though painful, this decline has improved the free cash flow yield profile of the index to 5.4% at the start of June, a level last seen in October of 2010. After a 5.4% gain for the S&P 400 in May, valuations are a bit less appealing, but sentiment has been washed out, in our view, and with earnings estimates moving lower, mid-caps could be well positioned to overdeliver.

Source: Bloomberg
Historically, valuation extremes have been hallmarks of a true bottom in sentiment for mid-cap stocks, and with that condition in place at month-end and 2025 earnings estimates having fallen by 10% in the past six months, the asset class has been sufficiently de-risked. We like the increased cyclical exposure the index brings with 40% in industrials, financials, and consumer discretionary stocks, and we believe it could be an interesting time to establish or overweight a position. Mid cap also has more exposure to datacenter infrastructure and utilities, which will play a key role in the rollout and usage of artificial intelligence (AI) in the coming years.
Source: Bloomberg
The drivers behind an improved risk/reward setup for mid-caps is the inverse of what we see for developed international equities in the near-term as these stocks have made a remarkable comeback, with the MSCI EAFE returning 17.3% since December. That price movement has brought with it richer valuations, going from cheap to in-line with that of U.S. mid-caps, while earnings estimates have seen modest improvement. Less appealing valuations abroad, only modest improvement in fundamentals, and outperformance largely driven by U.S. dollar depreciation led us to view international developed stocks as a source of funds to move to an overweight position in U.S. mid-caps. To be clear, we see signs of an improved economic outlook in the Eurozone, specifically, driven by accommodative monetary and fiscal policies, but euro area indices have benefited from sizable inflows which could dry up, presenting a tactical risk for these stocks.
Relative performance in emerging markets has been largely driven by country allocation this year. The MSCI Emerging Markets (EM) index rose 8.5% through May, buoyed by weakness in the U.S. dollar and falling energy prices, but performance dispersion at the country level has been stark, driving investor experience in the space up to this point in 2025. Active managers carrying overweight positions in Brazil, Mexico, South Africa, and South Korea have likely fared well, while those allocating heavily to India and Taiwan are most likely lagging peers and the broader MSCI EM index, all else being equal.
There were signs of rotation within EM during May as investors took chips off the table in Latin America, specifically Brazil, after strong year-to-date performance and deployed proceeds into South Korea which had been a solid performer, while dipping a toe into laggard Taiwan. We continue to see attractive opportunities to deploy capital across the emerging market landscape, but success investing in this space will likely remain a country selection story instead of a ‘rising tide lifts all ships’ type of scenario as some central banks are better positioned than others to ease monetary policy in the coming quarters to spur economic growth.
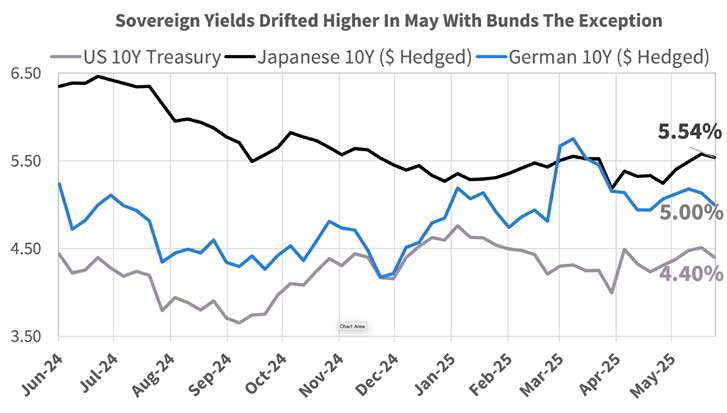
Treasuries have returned to fair value after a back-up in yields. U.S. Treasuries had a lot of negative headlines thrown at them in May and yields across the Treasury curve moved higher as a result. Rating agency Moody’s downgraded the U.S. credit rating in the back-half of the month due to concerns that a budget bill passed by the House of Representatives would make an already unsustainable fiscal path forward for the U.S. government even more so. Moody’s decision coincided with an unsettling move higher for Japanese Government Bond (JGB) yields, which forced yields on Treasuries and Eurozone sovereigns higher to put those issues on comparable footing with JGBs and attract capital.
Source: Bloomberg
While the Bloomberg U.S. Aggregate Bond index managed to post a respectable 2.4% year-to-date return through May, investors in higher quality, longer duration bonds had to stomach substantial interest rate volatility along the way to garner such a meager return, a less than appealing proposition. Uncertainty surrounding tariffs and the contents of the budget bill being bandied about in the Senate will likely be with us throughout June and should keep upward pressure on yields for longer-term U.S. Treasury bonds in the coming month(s). However, bond bulls can take some solace from the fact that despite the debt rating downgrade, horse trading taking place in D.C. on the budget bill, and the push higher from JGB yields, the 10-year U.S. Treasury yield still failed to close above 4.60% last month. Concerns surrounding a potential drop-off in demand for U.S. Treasuries from central banks and other investors abroad have so far been overblown, as recent Treasury auctions have eased concerns with buyers willing to step in after the back-up in rates during April and May – for now.
From a technical perspective, a break below 4.25% for the 10-year yield would be notable and could bring 4% into play, while a move above May resistance at 4.60% could quickly bring the January ceiling of 4.80% into the picture. Yields on long-dated U.S. Treasuries and sovereign issues in the Eurozone and U.K. were trading hands in early June close to the midpoint of their year-to-date trading ranges in many cases, but we see little reason for yields to break meaningfully higher or lower in the near-term, leaving us neutral across fixed income sub-asset classes as we look for relative value opportunities to tactically shift exposures.
While historically tight spreads make high yield look richly valued, total return potential continues to appear attractive.The Bloomberg U.S. Corporate High Yield index generated a 1.7% return in May as credit got pricier with spreads compressing and trade uncertainty abating. The credit spread on the Bloomberg High Yield Corporate index, or the yield required over Treasuries to compensate investors for taking credit risk, compressed by a staggering 69-basis points last month. This strong vote of confidence from investors in corporate issuers was confirmed by tighter spreads on the lowest quality CCC-rated segment of the high yield market which saw its spread compress 70-bps. Risk taking in CCC-rated bonds gives us confidence that sentiment surrounding the economy has stabilized, opening the door – or perhaps a window, to dial-up beta in areas like mid-cap stocks. It is also worth noting that high yield valuations still fall short of ‘stretched’ territory as the index OAS remains above 300-bps, higher than the 287-bps where it started the year. Our outlook for the space centers on the premise that, while credit is not yet egregiously overpriced, it is teetering on the brink of rarified air, leaving little upside potential over yield-to-worst at the present time.
Hedge fund strategies, except for macro, produced positive performance through May. The HFR Equity Hedge and HFR Event Driven indices outperformed the S&P 500, and the HFRI Relative Value outperformed the Barclay’s Aggregate Index through May. Macro strategies, notably systematic macro, were the notable detractors as price volatility and sharp swings in trade policy resulted in underperformance through May. For those willing and able to take some liquidity risk, relative value hedge fund strategies look poised to perform well relative to high yield and other credit strategies. These strategies typically exhibit the strongest relative performance versus their more liquid counterparts when spreads are tight.
IMPORTANT DISCLOSURES: This publication has been prepared by the staff of Highland Associates, Inc. for distribution to, among others, Highland Associates, Inc. clients. Highland Associates is registered with the United States Security and Exchange Commission under the Investment Advisors Act of 1940. Highland Associates is a wholly owned subsidiary of Regions Bank, which in turn is a wholly owned subsidiary of Regions Financial Corporation. Research services are provided through Multi-Asset Solutions, a department of the Regions Asset Management business group within Regions Bank. The information and material contained herein is provided solely for general information purposes only. To the extent these materials reference Regions Bank data, such materials are not intended to be reflective or indicative of, and should not be relied upon as, the results of operations, financial conditions or performance of Regions Bank. Unless otherwise specifically stated, any views, opinions, analyses, estimates and strategies, as the case may be (“views”), expressed in this content are those of the respective authors and speakers named in those pieces and may differ from those of Regions Bank and/or other Regions Bank employees and affiliates. Views and estimates constitute our judgment as of the date of these materials, are often based on current market conditions, and are subject to change without notice. Any examples used are generic, hypothetical and for illustration purposes only. Any prices/quotes/statistics included have been obtained from sources believed to be reliable, but Highland Associates, Inc. does not warrant their completeness or accuracy. This information in no way constitutes research and should not be treated as such. The views expressed herein should not be construed as individual investment advice for any particular person or entity and are not intended as recommendations of particular securities, financial instruments, strategies or banking services for a particular person or entity. The names and marks of other companies or their services or products may be the trademarks of their owners and are used only to identify such companies or their services or products and not to indicate endorsement, sponsorship, or ownership by Regions or Highland Associates. Employees of Highland Associates, Inc., may have positions in securities or their derivatives that may be mentioned in this report. Additionally, Highland’s clients and companies affiliated with Highland Associates may hold positions in the mentioned companies in their portfolios or strategies. This material does not constitute an offer or an invitation by or on behalf of Highland Associates to any person or entity to buy or sell any security or financial instrument or engage in any banking service. Nothing in these materials constitutes investment, legal, accounting or tax advice. Non-deposit products including investments, securities, mutual funds, insurance products, crypto assets and annuities: Are Not FDIC-Insured I Are Not a Deposit I May Go Down in Value I Are Not Bank Guaranteed I Are Not Insured by Any Federal Government Agency I Are Not a Condition of Any Banking Activity.
Neither Regions Bank nor Regions Asset Management (collectively, “Regions”) are registered municipal advisors nor provide advice to municipal entities or obligated persons with respect to municipal financial products or the issuance of municipal securities (including regarding the structure, timing, terms and similar matters concerning municipal financial products or municipal securities issuances) or engage in the solicitation of municipal entities or obligated persons for such services. With respect to this presentation and any other information, materials or communications provided by Regions, (a) Regions is not recommending an action to any municipal entity or obligated person, (b) Regions is not acting as an advisor to any municipal entity or obligated person and does not owe a fiduciary duty pursuant to Section 15B of the Securities Exchange Act of 1934 to any municipal entity or obligated person with respect to such presentation, information, materials or communications, (c) Regions is acting for its own interests, and (d) you should discuss this presentation and any such other information, materials or communications with any and all internal and external advisors and experts that you deem appropriate before acting on this presentation or any such other information, materials or communications.
Source: Bloomberg Index Services Limited. BLOOMBERG® is a trademark and service mark of Bloomberg Finance L.P. and its affiliates (collectively “Bloomberg”). BARCLAYS® is a trademark and service mark of Barclays Bank Plc (collectively with its affiliates, “Barclays”), used under license. Bloomberg or Bloomberg’s licensors, including Barclays, own all proprietary rights in the Bloomberg Barclays Indices. Neither Bloomberg nor Barclays approves or endorses this material or guarantees the accuracy or completeness of any information herein, or makes any warranty, express or implied, as to the results to be obtained therefrom and, to the maximum extent allowed by law, neither shall have any liability or responsibility for injury or damages arising in connection therewith.