Stocks: U.S. Indices End The Week With Modest Losses As Geopolitical Risk Caps Gains; Further Signs Of Thawing In The IPO Market; Crude Oil, Energy Stocks Spike On Israel/Iran Tensions Amid Offsides Positioning; U.S. Dollar Doesn’t Benefit From Safe-Haven Flows, Providing A Tailwind For Emerging Market Assets.
Download Weekly Market Commentary | June 16 2025
What We’re Watching:
- May Retail Sales are released Tuesday with the control group expected to rise 0.3% month over month, which would be an improvement versus April’s -0.2% reading.
- The Federal Open Market Committee (FOMC) concludes its two-day meeting on Wednesday. The Committee is widely expected to leave the Fed funds rate unchanged, but any shifts in the FOMC’s expectations for inflation and interest rates included in the closely watched Summary of Economic Projections, otherwise known as the dot-plot, could prove market moving.
- Initial jobless claims for the week ended June 14 and continuing jobless claims for the week ended June 7 are released Wednesday. Both readings are worth watching for signs of stabilization after each metric has trended higher in recent weeks.
Key Observations
- Rising tensions in the Middle East as Israel launched an attack on Iran’s nuclear weapons facilities weighed on sentiment and investor risk appetite into the weekend. However, the resiliency on display by U.S. equities despite this rise in geopolitical unrest is encouraging as the S&P 500 fell only modestly on the week.
- Traditional safe-haven assets such as gold, the Japanese yen, and U.S. Treasuries played that role well on the week, but the U.S. dollar, which typically benefits from flight to safety flows closed the week lower. This is a disconnect worth watching in the coming weeks as a failure to hold the 98 level for the U.S. dollar index (DXY) could usher in a move to the mid-90’s in the coming months.
- U.S. Treasuries rallied and yields fell sharply due to cooler May inflation readings, strong 10- and 30-year Treasury auctions, and flight to safety inflows as Middle East tensions flared. However, on the heels of Israel’s attack on Iran, crude oil prices spiked stoking fears that inflation readings will rise in the coming months, putting upward pressure on yields into the weekend.
What Happened Last Week:
Stocks: U.S. Indices End The Week With Modest Losses As Geopolitical Risk Caps Gains; Further Signs Of Thawing In The IPO Market; Crude Oil, Energy Stocks Spike On Israel/Iran Tensions Amid Offsides Positioning; U.S. Dollar Doesn’t Benefit From Safe-Haven Flows, Providing A Tailwind For Emerging Market Assets.
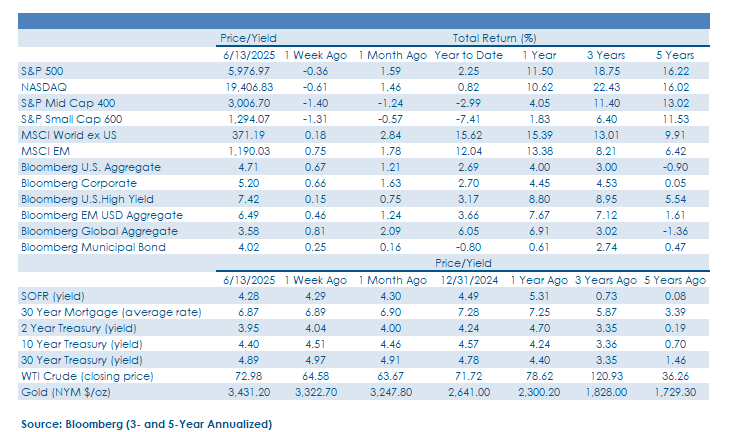
Continued Resiliency Out Of U.S. Equities As Indices Weather The Geopolitical Storm Well. U.S. equity indices managed to largely shrug off rising Middle East tensions to close the week with modest losses. The S&P 500 fell 0.4% as the energy, health care, information technology, and utilities sectors all turned out gains, while financials and industrials, economically sensitive sectors that had led in recent months, experienced profit taking and were the largest detractors on the week.
IPO Pipeline Continues To Churn Out Winners, But At Some Point We Risk Having ‘Too Much Of A Good Thing.’ The initial public offering (IPO) pipeline continued to churn out newly public companies as fintech Chime (CHYM) began trading on Thursday, and even after pricing above the high-end of its expected range, the stock rose by 37% on its first day of trading. Recent IPOs have been almost universally well received by investors which should lead to an active market for IPOs in the coming quarter(s). However, should private equity sponsors seeking to exit positions start to flood a more receptive market with lower quality issues, prices could fall and investor risk appetite wane.
Semiconductors Providing Leadership; How One Plays Defense Matters. The S&P 500 fell just 0.4% on the week, and under the surface there were some notable areas of strength worth highlighting. Specifically, semiconductor stocks continued to perform well with the Philadelphia Semiconductor Index (SOX) rising 1.5% on the week and strength out of this industry group kept the S&P 500 information technology sector nearly flat on the week. Semiconductor stocks have historically been viewed as economically sensitive, ebbing and flowing with the economic cycle, but now appear to be more of a secular growth story given the focus on leveraging artificial intelligence (AI) capabilities in the U.S. and abroad. Performance dispersion across traditionally defensive sectors was notable last week as health care led the charge, rising 1.3% on the week and trailing only the energy sector’s 5.8% gain, while utilities rose 0.3% as the sector benefitted from the drop in U.S. Treasury yields. On the other end of the spectrum, consumer staples fell 1.1% due to weakness out of names in the packaged goods space as profit margins were called into question and put under the microscope.
Crude Oil, Energy Stocks Spike As Israel Attacks Iran, Spurring Concerns Of Supply Disruptions. West Texas Intermediate (WTI) crude oil rallied $8.50 per barrel, or 13%, last week as the U.S. evacuated embassies throughout the Middle East mid-week in the lead up to Israel launching an attack on Iran’s uranium enrichment facilities used to aid in the manufacture of nuclear weapons.The spike in WTI pulled the S&P 500 energy sector higher by 5.8% on the week. WTI has been in a sustained downtrend after peaking at $80 per barrel in mid-January, but WTI appeared to find a durable bottom around $57 in early May and has now rallied over 27% off last month’s low. Market participants have remained bearish on the outlook for crude oil as trade uncertainty led to downgrades in the global growth outlook, which drove sizable short positions in the commodity. Last week’s news out of the Middle East initially spurred short covering and what looked like half-hearted long-only buying into the weekend as additional attacks appear likely in the coming days/weeks. However, while a geopolitical risk premium may continue to be priced into crude oil, the demand outlook is little changed, and fundamentals should ultimately put downward pressure on prices as the summer months pass. WTI closed last week at $72 and change, and we look to $77 and then $80 per barrel as potential resistance on the upside should escalation continue in the Middle East.
U.S. Dollar Index (DXY) Hits Lowest Level Since March Of 2022. The U.S. Dollar Index (DXY) made a new year-to-date low last Thursday, falling to 97.83, its lowest level dating back to March of 2022 despite rising tensions in the Middle East. Historically, geopolitical unrest spurs a flight to safety with the U.S. dollar, Japanese yen, gold, and U.S. Treasuries garnering increased investors interest as ports in the storm. Of those four assets, only the U.S. dollar closed lower on the week, and the U.S. dollar bounced only modestly on Friday. This is a notable divergence worth watching as the DXY appeared to be carving out a bottom around 98, and with the DXY closing the week just above that level at 98.18, a weekly close below 98 could spur a technical move to 95 or thereabouts, a level last seen in January of ‘22.
Emerging Markets Rally Rolls On Due To U.S. Dollar Weakness And Strength Out Of South Korea, Taiwan. The MSCI Emerging Markets (EM) index managed to eke out a 0.8% gain last week with the ‘usual suspects’ driving upside. South Korea’s Kospi gained another 1.4% and built on the prior week’s 6.2% surge. Taiwan’s Capitalization Weighted Stock Index (TAIEX) rose another 1.5% last week on its way to a 5.4% month-to-date gain.
Bonds: Treasury Yields Close Sharply Lower Amid Cooler Inflation, Strong Auction Results. Rising Mid-East Tensions; Treasury Auctions Well-Received As Demand From Abroad Remains Robust.
Inflation Readings, Treasury Auctions, Geopolitics Spur Buying In Treasuries. Yields on U.S. Treasuries fell across the curve over the balance of last week as cooler CPI and PPI readings from May, robust demand for long-term bonds mid-week at auction, and rising geopolitical risk on the heels of Israel’s attack on Iran’s nuclear weapons facilities spurred safe-haven demand. Interestingly, while the 10-year yield fell by 10-basis points on the week to close at 4.40%, the 10-year sold off on Friday with the yield rising 5-basis points after Israel’s attack. The rise in yield despite heightened geopolitical risk is primarily a function of the rise in crude oil prices as investors priced-in higher inflation readings in the coming months.
May Core CPI Cooler Than Expected But Unlikely To Alter The Path Forward For The Fed. The May Consumer Price Index (CPI) was released last Wednesday with the headline reading rising 0.1% month over month and 2.4% versus estimates of 0.2% and 2.4%. The more closely watched core CPI rose 0.1% month over month and 2.8% year over year, compared to the consensus estimate of 0.1% and 2.9%. So far, there remains little evidence that tariffs are putting upward pressure on goods prices at present, but we still expect upward pressure on prices of core goods in the coming months. However, faster disinflation on the services pricing front is anticipated to act as an offset. From a monetary policy perspective, the May CPI release is unlikely to alter the path forward as the FOMC will likely remain in wait and see mode throughout the summer as resiliency in the labor market provides cover for the Committee to stand pat to see how tariffs ultimately impact the inflation data in the coming months. We expect a total of 50-basis points of cuts to the Fed funds rate between now and year-end, with September the earliest the FOMC is likely to adjust its monetary policy stance.
Treasury Auctions Met With Strong Demand. The U.S. Treasury auctioned off $30B of 10-year notes on Wednesday and followed that up with $22B of 30-year bonds on Thursday. For the 10-year, indirect bidders – primarily foreign central banks – took down the lion’s share of the issue and the dealer community was forced to inventory less than 9% of the issue, a low percentage relative to the ten-auction average. The 10-year was trading with a yield closer to 4.45% in the lead up to the auction, but due to strong demand, the newly issued bonds were sold with a high yield of 4.421%, inside of where ‘on the run’ 10-year notes were trading. On Thursday, the 30-year issue was also met by strong demand as the high yield of 4.84% was a basis point inside of the where 30-years were trading hands in the market. The dealer community took down just 11.4% of the issue, the lowest percentage since November of last year. All told, these two auctions provided further evidence that there remains strong demand for long-dated U.S. Treasuries from abroad as well as from pension plans and insurance companies seeking to match long duration liabilities with long duration assets.
IMPORTANT DISCLOSURES: THIS PUBLICATION HAS BEEN PREPARED BY THE STAFF OF HIGHLAND ASSOCIATES, INC. FOR DISTRIBUTION TO, AMONG OTHERS, HIGHLAND ASSOCIATES, INC. CLIENTS. HIGHLAND ASSOCIATES IS REGISTERED WITH THE UNITED STATES SECURITY AND EXCHANGE COMMISSION UNDER THE INVESTMENT ADVISORS ACT OF 1940. HIGHLAND ASSOCIATES IS A WHOLLY OWNED SUBSIDIARY OF REGIONS BANK, WHICH IN TURN IS A WHOLLY OWNED SUBSIDIARY OF REGIONS FINANCIAL CORPORATION. RESEARCH SERVICES ARE PROVIDED THROUGH MULTI-ASSET SOLUTIONS, A DEPARTMENT OF THE REGIONS ASSET MANAGEMENT BUSINESS GROUP WITHIN REGIONS BANK. THE INFORMATION AND MATERIAL CONTAINED HEREIN IS PROVIDED SOLELY FOR GENERAL INFORMATION PURPOSES ONLY. TO THE EXTENT THESE MATERIALS REFERENCE REGIONS BANK DATA, SUCH MATERIALS ARE NOT INTENDED TO BE REFLECTIVE OR INDICATIVE OF, AND SHOULD NOT BE RELIED UPON AS, THE RESULTS OF OPERATIONS, FINANCIAL CONDITIONS OR PERFORMANCE OF REGIONS BANK. UNLESS OTHERWISE SPECIFICALLY STATED, ANY VIEWS, OPINIONS, ANALYSES, ESTIMATES AND STRATEGIES, AS THE CASE MAY BE (“VIEWS”), EXPRESSED IN THIS CONTENT ARE THOSE OF THE RESPECTIVE AUTHORS AND SPEAKERS NAMED IN THOSE PIECES AND MAY DIFFER FROM THOSE OF REGIONS BANK AND/OR OTHER REGIONS BANK EMPLOYEES AND AFFILIATES. VIEWS AND ESTIMATES CONSTITUTE OUR JUDGMENT AS OF THE DATE OF THESE MATERIALS, ARE OFTEN BASED ON CURRENT MARKET CONDITIONS, AND ARE SUBJECT TO CHANGE WITHOUT NOTICE. ANY EXAMPLES USED ARE GENERIC, HYPOTHETICAL AND FOR ILLUSTRATION PURPOSES ONLY. ANY PRICES/QUOTES/STATISTICS INCLUDED HAVE BEEN OBTAINED FROM SOURCES BELIEVED TO BE RELIABLE, BUT HIGHLAND ASSOCIATES, INC. DOES NOT WARRANT THEIR COMPLETENESS OR ACCURACY. THIS INFORMATION IN NO WAY CONSTITUTES RESEARCH AND SHOULD NOT BE TREATED AS SUCH. THE VIEWS EXPRESSED HEREIN SHOULD NOT BE CONSTRUED AS INDIVIDUAL INVESTMENT ADVICE FOR ANY PARTICULAR PERSON OR ENTITY AND ARE NOT INTENDED AS RECOMMENDATIONS OF PARTICULAR SECURITIES, FINANCIAL INSTRUMENTS, STRATEGIES OR BANKING SERVICES FOR A PARTICULAR PERSON OR ENTITY. THE NAMES AND MARKS OF OTHER COMPANIES OR THEIR SERVICES OR PRODUCTS MAY BE THE TRADEMARKS OF THEIR OWNERS AND ARE USED ONLY TO IDENTIFY SUCH COMPANIES OR THEIR SERVICES OR PRODUCTS AND NOT TO INDICATE ENDORSEMENT, SPONSORSHIP, OR OWNERSHIP BY REGIONS OR HIGHLAND ASSOCIATES. EMPLOYEES OF HIGHLAND ASSOCIATES, INC., MAY HAVE POSITIONS IN SECURITIES OR THEIR DERIVATIVES THAT MAY BE MENTIONED IN THIS REPORT. ADDITIONALLY, HIGHLAND’S CLIENTS AND COMPANIES AFFILIATED WITH HIGHLAND ASSOCIATES MAY HOLD POSITIONS IN THE MENTIONED COMPANIES IN THEIR PORTFOLIOS OR STRATEGIES. THIS MATERIAL DOES NOT CONSTITUTE AN OFFER OR AN INVITATION BY OR ON BEHALF OF HIGHLAND ASSOCIATES TO ANY PERSON OR ENTITY TO BUY OR SELL ANY SECURITY OR FINANCIAL INSTRUMENT OR ENGAGE IN ANY BANKING SERVICE. NOTHING IN THESE MATERIALS CONSTITUTES INVESTMENT, LEGAL, ACCOUNTING OR TAX ADVICE. NON-DEPOSIT PRODUCTS INCLUDING INVESTMENTS, SECURITIES, MUTUAL FUNDS, INSURANCE PRODUCTS, CRYPTO ASSETS AND ANNUITIES: ARE NOT FDIC-INSURED I ARE NOT A DEPOSIT I MAY GO DOWN IN VALUE I ARE NOT BANK GUARANTEED I ARE NOT INSURED BY ANY FEDERAL GOVERNMENT AGENCY I ARE NOT A CONDITION OF ANY BANKING ACTIVITY.
NEITHER REGIONS BANK NOR REGIONS ASSET MANAGEMENT (COLLECTIVELY, “REGIONS”) ARE REGISTERED MUNICIPAL ADVISORS NOR PROVIDE ADVICE TO MUNICIPAL ENTITIES OR OBLIGATED PERSONS WITH RESPECT TO MUNICIPAL FINANCIAL PRODUCTS OR THE ISSUANCE OF MUNICIPAL SECURITIES (INCLUDING REGARDING THE STRUCTURE, TIMING, TERMS AND SIMILAR MATTERS CONCERNING MUNICIPAL FINANCIAL PRODUCTS OR MUNICIPAL SECURITIES ISSUANCES) OR ENGAGE IN THE SOLICITATION OF MUNICIPAL ENTITIES OR OBLIGATED PERSONS FOR SUCH SERVICES. WITH RESPECT TO THIS PRESENTATION AND ANY OTHER INFORMATION, MATERIALS OR COMMUNICATIONS PROVIDED BY REGIONS, (A) REGIONS IS NOT RECOMMENDING AN ACTION TO ANY MUNICIPAL ENTITY OR OBLIGATED PERSON, (B) REGIONS IS NOT ACTING AS AN ADVISOR TO ANY MUNICIPAL ENTITY OR OBLIGATED PERSON AND DOES NOT OWE A FIDUCIARY DUTY PURSUANT TO SECTION 15B OF THE SECURITIES EXCHANGE ACT OF 1934 TO ANY MUNICIPAL ENTITY OR OBLIGATED PERSON WITH RESPECT TO SUCH PRESENTATION, INFORMATION, MATERIALS OR COMMUNICATIONS, (C) REGIONS IS ACTING FOR ITS OWN INTERESTS, AND (D) YOU SHOULD DISCUSS THIS PRESENTATION AND ANY SUCH OTHER INFORMATION, MATERIALS OR COMMUNICATIONS WITH ANY AND ALL INTERNAL AND EXTERNAL ADVISORS AND EXPERTS THAT YOU DEEM APPROPRIATE BEFORE ACTING ON THIS PRESENTATION OR ANY SUCH OTHER INFORMATION, MATERIALS OR COMMUNICATIONS.
SOURCE: BLOOMBERG INDEX SERVICES LIMITED. BLOOMBERG® IS A TRADEMARK AND SERVICE MARK OF BLOOMBERG FINANCE L.P. AND ITS AFFILIATES (COLLECTIVELY “BLOOMBERG”). BARCLAYS® IS A TRADEMARK AND SERVICE MARK OF BARCLAYS BANK PLC (COLLECTIVELY WITH ITS AFFILIATES, “BARCLAYS”), USED UNDER LICENSE. BLOOMBERG OR BLOOMBERG’S LICENSORS, INCLUDING BARCLAYS, OWN ALL PROPRIETARY RIGHTS IN THE BLOOMBERG BARCLAYS INDICES. NEITHER BLOOMBERG NOR BARCLAYS APPROVES OR ENDORSES THIS MATERIAL OR GUARANTEES THE ACCURACY OR COMPLETENESS OF ANY INFORMATION HEREIN, OR MAKES ANY WARRANTY, EXPRESS OR IMPLIED, AS TO THE RESULTS TO BE OBTAINED THEREFROM AND, TO THE MAXIMUM EXTENT ALLOWED BY LAW, NEITHER SHALL HAVE ANY LIABILITY OR RESPONSIBILITY FOR INJURY OR DAMAGES ARISING IN CONNECTION THEREWITH.