
Download Asset Allocation | February 2025
Should I Stay, or Should I Go?
Economic Update
Uncertainty around policy and continued volatility
By Regions Economic Division
With Trump’s first and most recent bids for the White House, a vocal minority has stood in fierce opposition. Some individuals vowed to move abroad, perhaps to Canada, should Trump win. While a few followed through on promises, all but a relatively insignificant number have chosen to stay the course. With headlines in February dominated by tariffs, government job buyouts, and deportation squads, many faced a locational existential crisis of their own. Business owners, government employees, and immigrant workers alike are asking a question The Clash once posed: “Should I stay or should I go?”
Delays haven’t alleviated uncertainty. Proposed tariffs on Canada and Mexico may be postponed, but few are sure if Trump intends to follow through or “tease, tease, tease” for negotiating purposes. Reports of ICE raids have sent shockwaves through immigrant communities, and some 75,000 government employees have taken buyout offers. Some probationary employees found “if they stay it could be double” trouble when mass firings ensued for less tenured personnel at some government agencies. Even as the S&P 500 flirts w ith r ecord h ighs, l ingering d oubts a bout policy, growth, and valuations persist. With the rapidly changing landscape, will markets go lower? Or will they stay and continue their steady climb? February is historically a treacherous month for stocks, but certainty around policy or positive geopolitical developments could be encouraging for sentiment and asset prices. For many workers and investors, the question of whether to stay or go remains as pressing as ever.
Amid the uncertainty looming over the policy outlook, the dramatic headlines about on again/off again trade wars, and what remains a high degree of volatility in the financial markets, it can be easy to lose sight of the fact that the U.S. economy keeps pushing forward, let alone that it continues to do so at a faster pace than is the case across much of the world. It is, of course, reasonable to ask whether that will remain the case, particularly with businesses expressing frustration with policy uncertainty and consumers expressing anxiety about inflation possibly reaccelerating. As for us, we’ve increasingly found ourselves trying to segregate the news from the noise from one day to the next without losing sight that our main task is, as always, trying to segregate the signals from the noise in the economic data. So, in that sense, the high volume of economic data over the past few weeks has been a welcome respite.
The first estimate from the U.S. Bureau of Economic Analysis (BEA) shows real GDP grew at an annual rate of 2.3% in Q4 2024, easily below what we and the consensus forecast had expected. The details of the data, however, are more in line with our expectations. Real private domestic demand, or combined business and household spending, grew at an annual rate of 3.2%, only modestly below the 3.4% growth rate logged in Q3. Our forecast miss on top- line real GDP growth was due to a sharply slower pace of inventory accumulation in the nonfarm business sector than we had anticipated, which knocked 0.93 percentage points off Q4 real GDP growth.
After the release of the initial Q4 GDP estimate, data showed the U.S. trade deficit widened substantially in December, which could lead to a downward revision to the first estimate of Q4 GDP growth. It should be noted, however, that inventory accumulation and global trade flows over the back half of 2024 were rocked by concerns over a potential port strike and fears of expanded tariffs in 2025. These disruptions played a part in the Q4 GDP data, and uncertainty over tariffs will likely continue to sway the data in coming months. Still, the data show consumer and business spending entered 2025 on solid footing, and that by year-end 2024 the pace of real GDP growth had fallen back in alignment with the trend rate that prevailed prior to the pandemic.
As it turned out, job growth was meaningfully slower over 2023 and 2024 than had previously been reported. This was due to the final revision that took 589,000 jobs off the seasonally adjusted count of nonfarm payrolls, which is larger than normal but closer to the hit of 600,000–650,000 jobs we originally expected. The revised data show the U.S. economy added 2.594 million jobs in 2023 and 1.996 million jobs in 2024; prior estimates showed 3.013 million and 2.232 million jobs, respectively. Rather than change our assessment of labor market conditions, however, the revisions put job growth on a trajectory much closer to what we’d suspected was the case, as we’d been on record going back to 2023 arguing that the monthly employment reports were overstating job growth. The January employment report also incorporated revised population controls around the household survey data which reflect the significant upward revision to the Census Bureau’s prior estimates of foreign in-migration over the 2022–2024 period (which we discussed last month). As with the establishment survey data, however, rather than changing our assessment of labor market conditions, this change supported our view that the household survey data had been meaningfully undercounting foreign-born labor.
The Institute for Supply Management’s (ISM) January survey of the manufacturing sector brought encouraging news. The ISM Manufacturing Index rose to 50.9%, ending a run of 26 straight months of contraction in the factory sector. The details of the data affirmed the improvement in the headline index, particularly a third straight month of rising new orders, with order growth broadening across firms and industry groups. Still, it remains to be seen whether, or to what extent, the improvement registered in the January survey will be sustained, as tariffs loom large in the background for many survey respondents. It is worth noting that the monthly data on core capital goods orders, a precursor of business investment in equipment and machinery in the GDP data, firmed up smartly over the past two months after having been oddly rangebound since early-2023. Again, though, it remains to be seen whether this nascent rebound will be blunted by trade disputes.
Continued uncertainty and/or volatility on the policy front will continue to impact households and firms. Along with the usual ebbs and flows of the economic data, this will likely contribute to elevated volatility in equity prices and interest rates, particularly to the extent that a “react first, analyze later” mindset prevails.
Sources: U.S. Bureau of Economic Analysis; U.S. Bureau of Labor Statistics; Institute for Supply Management
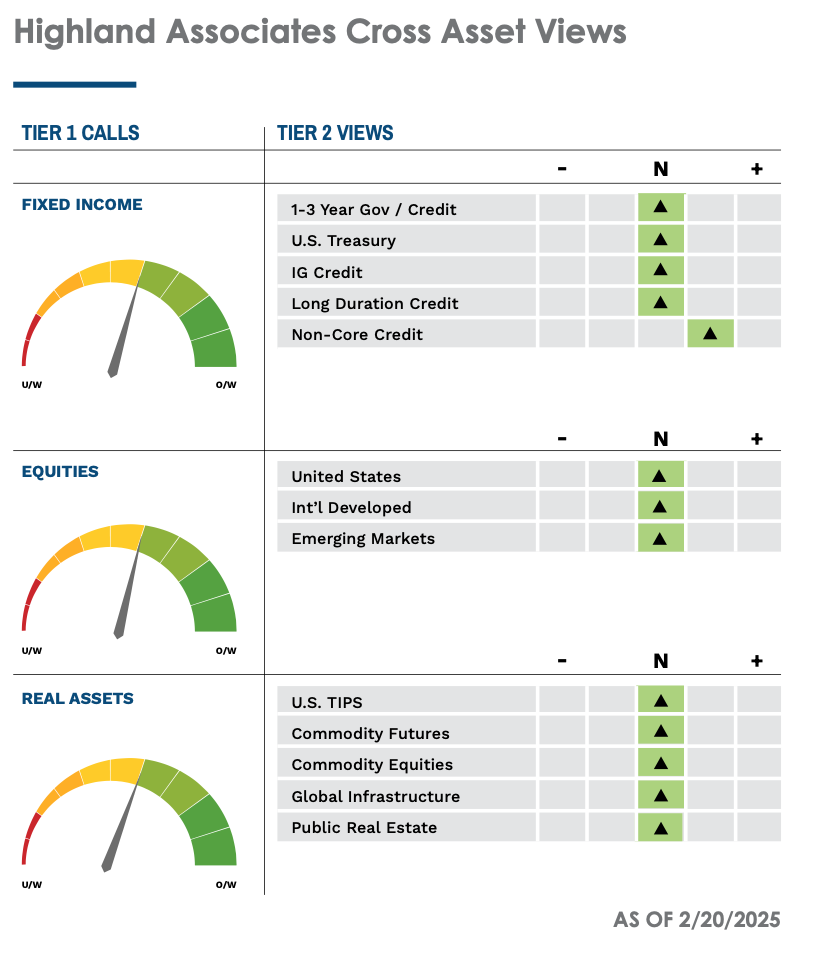
Investment Strategy Update
Regions Multi-Asset Solutions & Highland Associates
Headline risk reared its ugly head as February began, with the U.S. announcing intentions to levy 25% tariffs on certain goods imported from Canada and Mexico, and an additional 10% tariff on imports from China. After some contentious conversations with Canada and Mexico, the U.S. delayed tariffs on goods imported from both countries for “at least 30 days,” while moving forward with the up-sized tariffs on Chinese goods. China announced retaliatory tariffs of 15% on select imported goods from the U.S., but the limited scope and magnitude appeared to be little more than a face-saving move that many observers viewed as an attempt to de-escalate the situation. Investor sentiment and risk appetite could remain on shaky ground over the near-term as market participants grapple with uncertainty tied to trade, immigration, and taxes, along with the outlook for fiscal policy, with movement on any of these fronts potentially unsettling for investors in stocks and other riskier asset classes.
January proved profitable for investors in U.S. stocks as the S&P 500 turned out a 2.7% gain, while the S&P MidCap 400 and SmallCap 600 indices did even better, rallying 3.8% and 2.9%, respectively. Yale Hirsch, creator of the Stock Trader’s Almanac, devised the January Barometer in 1972, making note of the propensity for the S&P 500’s performance in January to set the tone for the year ahead. Gains in January have often implied a positive year ahead for the index, while a negative month has typically translated into a down year for the S&P 500, with the January Barometer proving to be reliable in almost 84% of calendar years dating back to 1950. By this measure, 2025 is poised to be another positive year for large-cap U.S. stocks, but policy-related hurdles and headwinds lie ahead and could limit near-term upside. February has a reputation for being a challenging month for stocks; since 1928, it is one of only three calendar months in which the S&P 500 has, on average, generated a negative return. With this backdrop in place, we wouldn’t be surprised to see volatility remain elevated and stocks struggle over the coming month, particularly after such a strong start to the year.
Upside could be limited on a tactical basis as the calendar turns unkind this month and policy uncertainty weighs on investor sentiment and risk appetite, but over the balance of 2025 we remain cautiously constructive on U.S. large- cap stocks. During January’s rally, capital rotated both within the Magnificent 7 and between sectors into names with more reasonable valuations and less lofty expectations, which leaves us encouraged that investors aren’t looking to exit stocks en masse but are continuing to “skate to where the puck is going,” not where it has been in recent years. Within the S&P 500, information technology was the only sector to close the month in negative territory, evidence of broader participation, which increases our confidence that the index can digest gains from ’23 and ’24 over time as opposed to requiring a meaningful price decline to build up buying interest and the necessary energy to make its next leg higher.
An uptick in IPO activity could prove to be a double- edged sword for small caps. The market’s pulse outside of the usual mega cap suspects was encouraging in January, as the S&P SmallCap 600 and S&P MidCap 400 both outpaced the S&P 500 during the month. Mid-caps and small-cap growth were specific standouts from a style perspective, rising 3.8% and 3.9%, respectively, while large-growth produced a more modest 1.9% return as less exposure to information technology stocks proved additive to relative returns. Macro tailwinds for small- and mid-cap stocks included yields on the 2-year U.S. Treasury falling 18 bps from the high-water mark mid- month, and the belief that tariffs could impact global- oriented companies in an outsized way played a role as well. On the margin, small caps derive less revenue from abroad, as the small-cap Russell 2000 garners 21% of sales from outside the U.S., while the S&P 500 is closer to 30% and the Magnificent 7 is closer to 49%. However, smaller companies still import intermediate goods from abroad and tend to be price takers, leaving these companies susceptible to earnings shortfalls should tariffs be levied in a broader manner. Our view that IPO activity should ramp up in the coming year(s) as deregulation and pro- business policies take root could be a double-edged sword for small caps, specifically.
Drop-Off in IPO Transaction Volume in Recent Years Points to Pent-Up Demand to Go Public – A Double-Edged Sword for SMid

Source: Bloomberg
Heavier equity issuance tends to coincide with healthy investor risk appetite, which provides a tailwind for smaller capitalization stocks; but flows into IPOs can come at the expense of small caps, which are viewed as higher beta and riskier exposures akin to the risks investors take when allocating capital to newly public companies. In 2022–’23, we saw the lowest IPO volume since 2008–’09, which implies pent-up demand for companies to tap the public markets for capital, in our view. We expect private equity sponsors to be more active in the coming quarters as they view this as a more opportune time to exit portfolio companies to realize value for investors. An uptick in IPO transactions could contribute to volatility in small caps in the coming quarters, but that could potentially be offset by a more active environment for mergers and acquisitions (M&A), which leaves us neutral on small- and mid-cap stocks at present.
Eurozone and U.K. stocks are potentially well positioned as global growth concerns build with trade in focus. Indices tracking eurozone and United Kingdom stocks have had a surprisingly strong start to the year, evidenced by the MSCI Eurozone and MSCI U.K. rallying 7.1% and 5.5%, respectively, in January. While little has changed regarding our economic outlook for the eurozone at large or the U.K., as we still see paltry economic growth in the coming year, that is a widely held view and market participants have seen little reason to allocate to Europe as a result. This may have contributed to January’s gains as offsides investors were forced to chase these stocks higher. Interestingly, rock-bottom growth expectations could leave eurozone and U.K. stocks somewhat insulated from trade-/tariff- related volatility, and with valuations somewhere between reasonable and cheap, these factors may be driving the year-to-date outperformance of these stocks.
The U.S. has focused its trade-related grievances on Canada, China, and Mexico up to this point and has only mentioned the prospect of tariffs on goods imported from the EU and U.K. in passing. Canada, China, and Mexico combined account for approximately 40% of U.S. imports, while the Eurozone and U.K. make up a much smaller percentage, and it’s worth noting that the U.S. runs a trade surplus with the U.K., so tariffs wouldn’t likely move the revenue needle much but could still be used as leverage to lower tariffs on U.S. exports to Europe. Lastly, both the British pound and euro have fallen by around 7% relative to the U.S. dollar since the end of September, which helps offset rising prices stemming from tariffs.
Trade Balance vs. Top U.S. Trade Partners in 2024 (in millions, negative sign implies U.S. trade deficit)
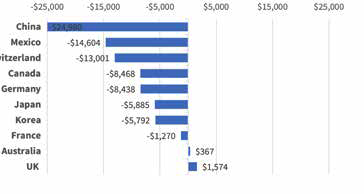
Source: Bloomberg
Emerging market stocks could be the canary in the coal mine to gauge how tariff talks are going. The U.S. Dollar Index (DXY) rallied sharply last month, reaching 109.95 as tariffs on Canada, China, and Mexico were bandied about, but sold off and ended the month modestly lower after the U.S. gave Canada and Mexico 30-day reprieves. Dollar weakness would provide a boost for foreign sales generated by U.S. large-cap stocks (S&P 500), particularly mega-cap technology stocks, but developing markets abroad would likely be bigger beneficiaries. Additional U.S. tariffs on goods imported from China seemed to get lost as tariff/trade rhetoric put Canada and Mexico front and center, but China responded to the announcement that the U.S. would levy a blanketed 10% tariff on goods the country exports to the U.S. by announcing 15% tariffs on a select (small) number of mostly inconsequential U.S. exports. Market participants viewed China’s response as evidence that the country seeks to avoid escalation and a tit-for-tat trade war, an approach that investors in both U.S. and Chinese stocks cheered with the MSCI China index turning out a 3.3% monthly gain. A solid start to the year for Chinese equities wasn’t the only bright spot in emerging markets, as the MSCI Brazil index gained 12.5% as Latin America rebounded from deeply oversold positions late last year. Currency volatility clouds the outlook for emerging markets, but the above average free cash flow growth and cheap valuations suggest developing EM equities could capitalize if trade headwinds abate and the U.S. dollar weakens.
It’s been a good start to 2025 for fixed-income investors, as core and non-core segments alike have produced gains six weeks into the new year. Riskier pockets of the bond market fared best out of the gate, with U.S. corporate high yield and emerging market debt outpacing higher-quality Treasuries and investment-grade corporate bonds into mid-January, as interest rates rose due to expectations that economic growth could surprise to the upside in the coming quarters. But that performance gap narrowed in early February as talk of U.S. tariffs on goods imported from Canada, China, and Mexico led to concerns surrounding the outlook for global growth, which, along with some signs of softness in U.S. economic data, put downward pressure on Treasury yields. This led to a rally in longer duration, interest rate sensitive bonds.
Offsides positioning also contributed to the move lower in Treasury yields as trend-following strategies entered February short U.S. Treasuries as signals led them to position portfolios with the expectation that Treasury yields would continue to climb. Portfolio managers were forced to cover short positions as the 10-year yield breached the key technical level of 4.50% to the downside, intensifying the move lower in yields. After a sizable countertrend move lower in yields, positioning is back to neutral and is now less likely to be a catalyst for yields to move sharply lower in the near-term. This backdrop presents investors with an opportunity early in the new year to revisit positioning with an aim at identifying durable, lasting trends capable of driving rates in the coming months versus short-lived overreactions to economic data.
The prospect of U.S. tariffs being levied on goods imported from Canada, China, Mexico, and perhaps the European Union poses a downside risk to U.S. economic growth, but at present we project the U.S. economy to grow real GDP at 2.4% in 2025, with core PCE, the FOMC’s preferred inflation gauge, coming in at 2.4%. With the 10-year Treasury yield hovering just north of 4.5%, this doesn’t leave much room for either economic growth or inflation to surprise to the upside over the near-term without potentially forcing yields on longer duration bonds higher. As a result, we see minimal near-term downside for Treasury yields and are looking at opportunities abroad in developed market sovereign bonds, specifically, as many issues carry competitive yields.
Developed market sovereign bonds are beginning to look attractive with current yields, and they may benefit from currency. The U.S. Treasury rally in late January/early February provided a shot in the arm for core fixed-income segments, but that rally has us increasingly looking abroad for opportunities to reduce the credit and duration risks in our U.S.-heavy fixed- income portfolios. Yields on emerging market debt remain above long-term averages at roughly 6.6%, but after returning 1.7% in January, we’re closer to profit-taking than we are allocating new capital to current positions with credit spreads approaching 10-year tight levels. Tight spreads and a desire to sit out what could be elevated volatility tied to the Treasury market leave us considering hedged foreign-developed bonds as a viable spot to deploy capital, as these bonds carry less U.S. duration risk with potential upside should the dollar remain relatively strong.
With eurozone inflation at 2.5%, below U.S. CPI at 3.0% as of January, and with a paltry outlook for economic growth in the euro area to boot, the case can be made that sovereign yields abroad have less potential upside than yields on U.S. Treasuries at present, particularly with the European Central Bank and Bank of England both easing monetary policy in the coming quarters due to lackluster growth. Select nations abroad are also showing more fiscal restraint and discipline with eurozone debt to GDP averaging 88% vs. the US at 131%, with expansionary fiscal policy unlikely abroad in the near-term. We’re content to wait patiently to see if yields on long-dated U.S. Treasuries can drift lower still, as 4.25% or thereabouts on the 10-year U.S. Treasury yield would make it easier to take off our overweight to core, investment-grade bonds stateside and reallocate that capital into developed market sovereigns abroad.
Despite challenges and uncertainty, January ended with an economic score that remained “risk-on.” HDI also maintained its total score of 100%. While uncertainty remains around policy changes in a new administration, the equity bull market held up for another month. While the future is always unknown, how we arrive at decisions about the future should not be. Is the cost of staying too high? What about the risk of leaving? For most, the default answer is inaction in an uncertain world. Changes in portfolios should be made with purpose, but only when the opportunity outweighs the cost. Positive catalysts on the horizon could continue to take equity markets higher, but all risk assets may not be so lucky. A potential ceasefire between Russia and Ukraine is one of many catalysts we continue to monitor in the month ahead that could impact equities, commodities, foreign exchange rates, and (of course) emerging markets.
IMPORTANT DISCLOSURES: This publication has been prepared by the staff of Highland Associates, Inc. for distribution to, among others, Highland Associates, Inc. clients. Highland Associates is registered with the United States Security and Exchange Commission under the Investment Advisors Act of 1940. Highland Associates is a wholly owned subsidiary of Regions Bank, which in turn is a wholly owned subsidiary of Regions Financial Corporation. Research services are provided through Multi-Asset Solutions, a department of the Regions Asset Management business group within Regions Bank. The information and material contained herein is provided solely for general information purposes only. To the extent these materials reference Regions Bank data, such materials are not intended to be reflective or indicative of, and should not be relied upon as, the results of operations, financial conditions or performance of Regions Bank. Unless otherwise specifically stated, any views, opinions, analyses, estimates and strategies, as the case may be (“views”), expressed in this content are those of the respective authors and speakers named in those pieces and may differ from those of Regions Bank and/or other Regions Bank employees and affiliates. Views and estimates constitute our judgment as of the date of these materials, are often based on current market conditions, and are subject to change without notice. Any examples used are generic, hypothetical and for illustration purposes only. Any prices/quotes/statistics included have been obtained from sources believed to be reliable, but Highland Associates, Inc. does not warrant their completeness or accuracy. This information in no way constitutes research and should not be treated as such. The views expressed herein should not be construed as individual investment advice for any particular person or entity and are not intended as recommendations of particular securities, financial instruments, strategies or banking services for a particular person or entity. The names and marks of other companies or their services or products may be the trademarks of their owners and are used only to identify such companies or their services or products and not to indicate endorsement, sponsorship, or ownership by Regions or Highland Associates. Employees of Highland Associates, Inc., may have positions in securities or their derivatives that may be mentioned in this report. Additionally, Highland’s clients and companies affiliated with Highland Associates may hold positions in the mentioned companies in their portfolios or strategies. This material does not constitute an offer or an invitation by or on behalf of Highland Associates to any person or entity to buy or sell any security or financial instrument or engage in any banking service. Nothing in these materials constitutes investment, legal, accounting or tax advice. Non-deposit products including investments, securities, mutual funds, insurance products, crypto assets and annuities: Are Not FDIC-Insured I Are Not a Deposit I May Go Down in Value I Are Not Bank Guaranteed I Are Not Insured by Any Federal Government Agency I Are Not a Condition of Any Banking Activity.
Neither Regions Bank nor Regions Asset Management (collectively, “Regions”) are registered municipal advisors nor provide advice to municipal entities or obligated persons with respect to municipal financial products or the issuance of municipal securities (including regarding the structure, timing, terms and similar matters concerning municipal financial products or municipal securities issuances) or engage in the solicitation of municipal entities or obligated persons for such services. With respect to this presentation and any other information, materials or communications provided by Regions, (a) Regions is not recommending an action to any municipal entity or obligated person, (b) Regions is not acting as an advisor to any municipal entity or obligated person and does not owe a fiduciary duty pursuant to Section 15B of the Securities Exchange Act of 1934 to any municipal entity or obligated person with respect to such presentation, information, materials or communications, (c) Regions is acting for its own interests, and (d) you should discuss this presentation and any such other information, materials or communications with any and all internal and external advisors and experts that you deem appropriate before acting on this presentation or any such other information, materials or communications.
Source: Bloomberg Index Services Limited. BLOOMBERG® is a trademark and service mark of Bloomberg Finance L.P. and its affiliates (collectively “Bloomberg”). BARCLAYS® is a trademark and service mark of Barclays Bank Plc (collectively with its affiliates, “Barclays”), used under license. Bloomberg or Bloomberg’s licensors, including Barclays, own all proprietary rights in the Bloomberg Barclays Indices. Neither Bloomberg nor Barclays approves or endorses this material or guarantees the accuracy or completeness of any information herein, or makes any warranty, express or implied, as to the results to be obtained therefrom and, to the maximum extent allowed by law, neither shall have any liability or responsibility for injury or damages arising in connection therewith.