Stocks: Investors ‘Bottom Fishing’ To Start The Year As Some Of 2024’s Laggards Lead; Deteriorating Market Breadth Worrisome, But Sentiment, Relative Strength Are Contrarian Signals Worth Watching; Emerging Markets Enter Correction Territory As Dollar Strength Drags On.
Download Weekly Market Commentary | January 13 2025
What We’re Watching:
- On Tuesday, the National Federation of Independent Business (NFIB) releases its small business optimism survey for December which is expected to fall to 101.5 from 101.7 in November.
- U.S. Producer Price Index (PPI) for December is released Tuesday with PPI Final Demand expected to rise 0.4% month over month and 3.5% year over year, compared to 0.4% and 3.0% readings in November.
- U.S. Consumer Price Index (CPI) for December is released Wednesday. Headline CPI is expected to rise 0.3% month over month, in-line with the November reading, and 2.9% year over year, which would be a notable jump from 2.7% the prior month. Core CPI, which excludes food and energy, is expected to rise 0.2% month over month and 3.3% year over year, readings that would fall in-line with the November release. After last week’s strong labor market data stoked inflation fears, investors may place greater emphasis on the December CPI, with a ‘hot’ reading putting additional upward pressure on Treasury yields and a ‘cool’ reading potentially leading to a ‘sigh of relief’ rally in longer duration Treasuries.
Key Observations
- U.S. stock indices continued to bounce around in a narrow trading range as rising Treasury yields tamped down investor enthusiasm and risk appetite to start the new year. Information technology stocks have been most negatively impacted by the upward pressure on yields and registering outflows as investors have reallocated portfolios away from last year’s leaders in the communication services, consumer discretionary, and information technology sectors and into some of 2024’s laggards such as clean energy, oil and gas, and biotechnology stocks.
- Market breadth has continued to narrow or deteriorate in the new year, but many institutional investors appeared to rebalance in the back-half of December, removing one potential headwind for stocks we were expecting to materialize in January. Sentiment has turned more bearish in the last month and with the S&P 500 approaching oversold territory, a bounce is increasingly likely.
- Good news on the U.S. economy proved to be bad news for holders of higher quality, longer duration bonds over the balance of last week as fears of inflation reaccelerating led to a sharp move higher in rates/yields. Treasuries and investment-grade corporate bonds lagged lower quality, higher yielding corporate issues on the week, a continuation of what was a durable trend throughout much of last year.
What Happened Last Week:
Stocks: Investors ‘Bottom Fishing’ To Start The Year As Some Of 2024’s Laggards Lead; Deteriorating Market Breadth Worrisome, But Sentiment, Relative Strength Are Contrarian Signals Worth Watching; Emerging Markets Enter Correction Territory As Dollar Strength Drags On.
Some Of Last Year’s Laggards Are Outperforming So Far In 2025. Industry groups such as clean energy, oil and gas, and biotechnology, among others, which performed poorly on a relative basis in 2024 have fared better early in the new year, while leadership areas including the ‘Magnificent 7’ have been a mixed bag with some high- profile names giving ground. This isn’t unusual as January has garnered a reputation as being a strong month for stocks and as a month for mean reversion with investors rotating/reallocating capital out of last year’s winners and into some of the underperformers from the prior year to take advantage of this strong seasonal lift in the broader indices. With leadership shifting in favor of last year’s losers, it’s of little surprise that the three best performing factors year-to-date have been high beta, high volatility, and high short interest. These factors tend to correlate or cluster in lower quality segments of the market, and while a rebound in some of 2024’s worst performing areas isn’t unusual early in the new year, this has coincided with a notable deterioration in market breadth, a worrisome sign.
Levels Worth Watching As Market Breadth Continues To Narrow. Just 16% of S&P 500 constituents traded above their 50-day moving average as of last Friday’s close, while 49% traded above their 200-day moving average. We previously highlighted the 60% threshold for the percentage of companies trading above their 200-day as a level that needed to hold for us to view the broader market as remaining on solid footing, and with that figure now below 50% with technical damage done, we are on watch for a deeper drawdown. The S&P 500 has kicked off the year by moving sideways with the index stuck between 5,867 and 5,975 prior to last Friday’s steep selloff on the blowout December payrolls report. Narrowing trading ranges such as what we’ve witnessed over the past three or so weeks typically are resolved by outsized moves in one direction or the other, often in the direction of the prevailing trend, but last Friday’s breakdown is a potential character change worth watching and could signal further weakness ahead. Earnings season kicking off later this week and/or investor sentiment improving in the lead-up to inauguration day on January 20th could act as positive catalysts for a relief rally after the sluggish start to the year. We look for any rally in the S&P 500 in the coming weeks to face resistance at the 50-day moving average of 5,950 and then around the early December all-time high of 6,090/6,100. On the downside, the 100-day moving average at 5,820 is worth watching after Friday’s close just above that number at 5,827. A break below the 100-day could bring 5,710-5,715 into play as that was where the S&P 500 traded on Election Day and a fill of that gap can’t be ruled out. A move down to early November levels would be a peak-to-trough drawdown of approximately 6% and might well be enough to draw the ‘buy the dip’ crowd back into the fray.
Stocks Ended ’24 On A Sour Note As Rebalancing, Hedge Fund Selling Hit, But Sentiment Is A Potential Contrarian Signal Worth Watching. Institutional investors appeared to be in rebalancing mode over the back-half of December, with many needing to sell stocks and buy bonds after outsized returns were generated in the former asset class over the balance of the year. This rebalancing came sooner than we expected and pulled forward selling we anticipated in January into December, which could serve to limit downside in the coming month(s). Sentiment is worth monitoring as the release of the American Association of Individual Investors (AAII) survey from January 8 continued to point toward more investors turning negative on the intermediate-term (6 month) outlook for stocks with just 34.7% ‘bullish,’ below the historical average of 37.5% and a notable drop from 40.7% when the survey was taken on December 18. The S&P 500 is also approaching oversold territory with a relative strength index (RSI) reading below 40 after last week’s pullback. A reading of 30 is generally considered ‘oversold,’ while a reading of 70 is considered ‘overbought,’ so we’re fast approaching oversold territory as bulls run for the hills. Fewer bulls and oversold conditions lead us to expect a bounce in the S&P 500 in the near-term as these are signs that sentiment is getting so bad that it becomes a tailwind.
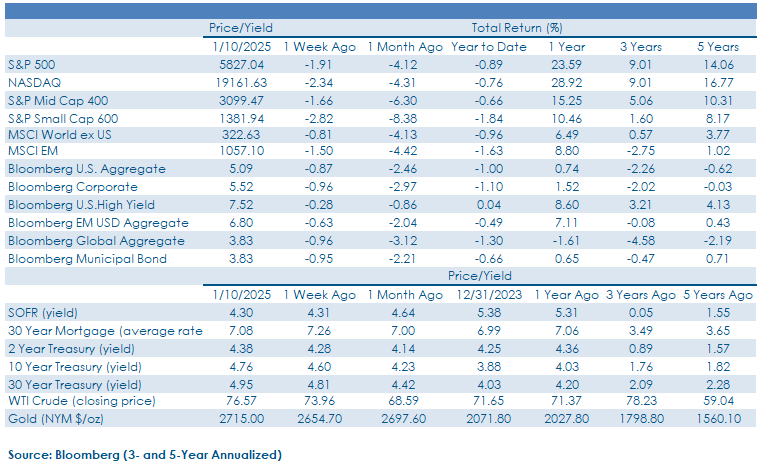
Emerging Market Indices Enter Correction Territory But Exporters Gain Despite Dollar Strength. The U.S. dollar strengthening in the fourth quarter and into the new year has left the MSCI Emerging Markets Equity index in correction territory, 11.6% off its October high and down 1.6% year-to-date. Dollar strength shaved roughly 5.6% off the MSCI EM Index’s return last year as the prospect of more protectionist trade policies in the U.S. weighed on prices for stocks in developing markets. China remains at the center of the trade fight as another curb on semiconductor exports from the U.S. into the country came down the pike last week, contributing to the 6.7% year-to-date decline in the MSCI China Index. Headline risk remains alive and well for emerging markets, but select exporters appear set to take advantage of the recent currency movement as rotation into undervalued nations has generated positive returns for South Korea, Brazil, and Mexico, among other 2024 laggards, early in the new year. The Latin America 40 Index currently trades at just 8.5 projected next twelve months earnings with a free cash flow yield of 13.3%. These are similar valuation metrics to those in place at the end of 2022 which set that Index up for a 33% return in 2023. 2025 is far from a perfect parallel, but these metrics capture just how cheap these stocks are and that bifurcation in the underlying country exposures could be an active managers dream in the coming year.
Bonds: Treasury Yields Move Higher As Strong Economic Data Stokes Inflation Fears, But The 10-Year Yield Encounters Resistance And Reverses Lower; FOMC Now Expected To Cut The Funds Rate By Just 25-Basis Points This Year; Room For Credit To Get Cheaper As Issuance Picks Up.
10-Year Treasury Yield Back To April 2024 Levels With Inflation In Focus. The 10-year U.S. Treasury yield continued its ascent last week, rising 15-basis points to close at 4.759%. This is a noteworthy move, but equally as notable is the fact that despite a series of encouraging economic data releases (ISM Services, December Nonfarm Payrolls) pointing toward continued upward pressure on inflation, the 10-year still failed to close convincingly above 4.75% as buyers appeared willing to step in at that level. We have long viewed the 4.70%/4.75% area as crucial resistance for the 10-year yield and floor of support for the price of those bonds, and last week’s price action reinforces the view that a break above that zone would potentially bring 5% or above into play in relatively short order. The market reaction to new Treasury supply last week could be described as a mixed bag with and heavily dependent upon the maturity of each issue as short- to intermediate- term bonds received a yawn from investors while 30-year paper was well-bid by direct bidders, primarily institutional investors and insurance companies, which took down an above average 20.7% of the issue. A craving for longer- term paper appears to be driven by a mix of limited supply of the long-term bonds coming to market, and with a 5% yield too boot, as well as some short covering as the momentum behind the recent sell-off fades.
Economic Data Points Toward Continued Upward Pressure On Prices, Inflation. A series of economic data releases last week put continued upward pressure on U.S. Treasury yields. Monday, the Institute for Supply Management (ISM) Services Index for December was released, with a headline reading of 54.1 showing modest growth/improvement over the 53.5 reading in November. But investors seemed to key off the sizable jump in the prices paid component of the index which spiked to 64.4 during the month from 57.5 the prior month and pointed toward continued upward pressure on prices and inflation in the coming months. On the labor front, we received the Job Openings and Labor Turnover Survey (JOLTS) for November which showed just shy of 8.1 million jobs open, above the consensus estimate of 7.74 million. To cap off the week, the December Nonfarm Payrolls report released Friday showed 256k jobs were created during the month, well above the 165k estimate. Taken together these data points are good news for the U.S. economy but are bad news for higher quality, longer duration bonds as they point toward additional upward pressure on prices/inflation in the coming months, leaving us with the opinion that the path of least resistance for Treasuries yields is likely still higher from here.
Credit Getting ‘Richer’ In The New Year, But Sustainability Of The Move Remains In Question. The Bloomberg U.S. Corporate High Yield Index fell 0.2% last week as Treasury yields rose, and credit spreads widened ever so slightly. This more measured move comes after credit spreads compressed/tightened by 13-basis points since the start of the year as a December selloff brought down valuations and yields climbed into year end. Notably, the knee-jerk response out of high yield bonds to the release of the minutes from the FOMC’s December meeting last Wednesday leaves us with the impression that investors are less than certain about where spreads will go from here, even with yields north of 7.5% expected to entice buyers on any weakness. Taking stock of 2024 issuance, we saw a substantial uptick in borrowing over the last 12-months that appears set to continue as street estimates are suggesting issuance could trend higher if merger activity rises and firms tap debt mar- kets to make deals. To date, 2025 issuance is a modest $3.3B, but new waves of issuance could provide a valu- able gauge of demand and, by extension, the direction of travel for spreads over the course of the year. Refinanc- ing activity can push out near-term maturity walls, and if defaults hold at current levels around historical averages, spreads have room to normalize (i.e. widen) somewhat given last week’s landing spot of 2.74% which stands well below the 3.04% median for last year.
IMPORTANT DISCLOSURES: THIS PUBLICATION HAS BEEN PREPARED BY THE STAFF OF HIGHLAND ASSOCIATES, INC. FOR DISTRIBUTION TO, AMONG OTHERS, HIGHLAND ASSOCIATES, INC. CLIENTS. HIGHLAND ASSOCIATES IS REGISTERED WITH THE UNITED STATES SECURITY AND EXCHANGE COMMISSION UNDER THE INVESTMENT ADVISORS ACT OF 1940. HIGHLAND ASSOCIATES IS A WHOLLY OWNED SUBSIDIARY OF REGIONS BANK, WHICH IN TURN IS A WHOLLY OWNED SUBSIDIARY OF REGIONS FINANCIAL CORPORATION. RESEARCH SERVICES ARE PROVIDED THROUGH MULTI-ASSET SOLUTIONS, A DEPARTMENT OF THE REGIONS ASSET MANAGEMENT BUSINESS GROUP WITHIN REGIONS BANK. THE INFORMATION AND MATERIAL CONTAINED HEREIN IS PROVIDED SOLELY FOR GENERAL INFORMATION PURPOSES ONLY. TO THE EXTENT THESE MATERIALS REFERENCE REGIONS BANK DATA, SUCH MATERIALS ARE NOT INTENDED TO BE REFLECTIVE OR INDICATIVE OF, AND SHOULD NOT BE RELIED UPON AS, THE RESULTS OF OPERATIONS, FINANCIAL CONDITIONS OR PERFORMANCE OF REGIONS BANK. UNLESS OTHERWISE SPECIFICALLY STATED, ANY VIEWS, OPINIONS, ANALYSES, ESTIMATES AND STRATEGIES, AS THE CASE MAY BE (“VIEWS”), EXPRESSED IN THIS CONTENT ARE THOSE OF THE RESPECTIVE AUTHORS AND SPEAKERS NAMED IN THOSE PIECES AND MAY DIFFER FROM THOSE OF REGIONS BANK AND/OR OTHER REGIONS BANK EMPLOYEES AND AFFILIATES. VIEWS AND ESTIMATES CONSTITUTE OUR JUDGMENT AS OF THE DATE OF THESE MATERIALS, ARE OFTEN BASED ON CURRENT MARKET CONDITIONS, AND ARE SUBJECT TO CHANGE WITHOUT NOTICE. ANY EXAMPLES USED ARE GENERIC, HYPOTHETICAL AND FOR ILLUSTRATION PURPOSES ONLY. ANY PRICES/QUOTES/STATISTICS INCLUDED HAVE BEEN OBTAINED FROM SOURCES BELIEVED TO BE RELIABLE, BUT HIGHLAND ASSOCIATES, INC. DOES NOT WARRANT THEIR COMPLETENESS OR ACCURACY. THIS INFORMATION IN NO WAY CONSTITUTES RESEARCH AND SHOULD NOT BE TREATED AS SUCH. THE VIEWS EXPRESSED HEREIN SHOULD NOT BE CONSTRUED AS INDIVIDUAL INVESTMENT ADVICE FOR ANY PARTICULAR PERSON OR ENTITY AND ARE NOT INTENDED AS RECOMMENDATIONS OF PARTICULAR SECURITIES, FINANCIAL INSTRUMENTS, STRATEGIES OR BANKING SERVICES FOR A PARTICULAR PERSON OR ENTITY. THE NAMES AND MARKS OF OTHER COMPANIES OR THEIR SERVICES OR PRODUCTS MAY BE THE TRADEMARKS OF THEIR OWNERS AND ARE USED ONLY TO IDENTIFY SUCH COMPANIES OR THEIR SERVICES OR PRODUCTS AND NOT TO INDICATE ENDORSEMENT, SPONSORSHIP, OR OWNERSHIP BY REGIONS OR HIGHLAND ASSOCIATES. EMPLOYEES OF HIGHLAND ASSOCIATES, INC., MAY HAVE POSITIONS IN SECURITIES OR THEIR DERIVATIVES THAT MAY BE MENTIONED IN THIS REPORT. ADDITIONALLY, HIGHLAND’S CLIENTS AND COMPANIES AFFILIATED WITH HIGHLAND ASSOCIATES MAY HOLD POSITIONS IN THE MENTIONED COMPANIES IN THEIR PORTFOLIOS OR STRATEGIES. THIS MATERIAL DOES NOT CONSTITUTE AN OFFER OR AN INVITATION BY OR ON BEHALF OF HIGHLAND ASSOCIATES TO ANY PERSON OR ENTITY TO BUY OR SELL ANY SECURITY OR FINANCIAL INSTRUMENT OR ENGAGE IN ANY BANKING SERVICE. NOTHING IN THESE MATERIALS CONSTITUTES INVESTMENT, LEGAL, ACCOUNTING OR TAX ADVICE. NON-DEPOSIT PRODUCTS INCLUDING INVESTMENTS, SECURITIES, MUTUAL FUNDS, INSURANCE PRODUCTS, CRYPTO ASSETS AND ANNUITIES: ARE NOT FDIC-INSURED I ARE NOT A DEPOSIT I MAY GO DOWN IN VALUE I ARE NOT BANK GUARANTEED I ARE NOT INSURED BY ANY FEDERAL GOVERNMENT AGENCY I ARE NOT A CONDITION OF ANY BANKING ACTIVITY.
NEITHER REGIONS BANK NOR REGIONS ASSET MANAGEMENT (COLLECTIVELY, “REGIONS”) ARE REGISTERED MUNICIPAL ADVISORS NOR PROVIDE ADVICE TO MUNICIPAL ENTITIES OR OBLIGATED PERSONS WITH RESPECT TO MUNICIPAL FINANCIAL PRODUCTS OR THE ISSUANCE OF MUNICIPAL SECURITIES (INCLUDING REGARDING THE STRUCTURE, TIMING, TERMS AND SIMILAR MATTERS CONCERNING MUNICIPAL FINANCIAL PRODUCTS OR MUNICIPAL SECURITIES ISSUANCES) OR ENGAGE IN THE SOLICITATION OF MUNICIPAL ENTITIES OR OBLIGATED PERSONS FOR SUCH SERVICES. WITH RESPECT TO THIS PRESENTATION AND ANY OTHER INFORMATION, MATERIALS OR COMMUNICATIONS PROVIDED BY REGIONS, (A) REGIONS IS NOT RECOMMENDING AN ACTION TO ANY MUNICIPAL ENTITY OR OBLIGATED PERSON, (B) REGIONS IS NOT ACTING AS AN ADVISOR TO ANY MUNICIPAL ENTITY OR OBLIGATED PERSON AND DOES NOT OWE A FIDUCIARY DUTY PURSUANT TO SECTION 15B OF THE SECURITIES EXCHANGE ACT OF 1934 TO ANY MUNICIPAL ENTITY OR OBLIGATED PERSON WITH RESPECT TO SUCH PRESENTATION, INFORMATION, MATERIALS OR COMMUNICATIONS, (C) REGIONS IS ACTING FOR ITS OWN INTERESTS, AND (D) YOU SHOULD DISCUSS THIS PRESENTATION AND ANY SUCH OTHER INFORMATION, MATERIALS OR COMMUNICATIONS WITH ANY AND ALL INTERNAL AND EXTERNAL ADVISORS AND EXPERTS THAT YOU DEEM APPROPRIATE BEFORE ACTING ON THIS PRESENTATION OR ANY SUCH OTHER INFORMATION, MATERIALS OR COMMUNICATIONS.
SOURCE: BLOOMBERG INDEX SERVICES LIMITED. BLOOMBERG® IS A TRADEMARK AND SERVICE MARK OF BLOOMBERG FINANCE L.P. AND ITS AFFILIATES (COLLECTIVELY “BLOOMBERG”). BARCLAYS® IS A TRADEMARK AND SERVICE MARK OF BARCLAYS BANK PLC (COLLECTIVELY WITH ITS AFFILIATES, “BARCLAYS”), USED UNDER LICENSE. BLOOMBERG OR BLOOMBERG’S LICENSORS, INCLUDING BARCLAYS, OWN ALL PROPRIETARY RIGHTS IN THE BLOOMBERG BARCLAYS INDICES. NEITHER BLOOMBERG NOR BARCLAYS APPROVES OR ENDORSES THIS MATERIAL OR GUARANTEES THE ACCURACY OR COMPLETENESS OF ANY INFORMATION HEREIN, OR MAKES ANY WARRANTY, EXPRESS OR IMPLIED, AS TO THE RESULTS TO BE OBTAINED THEREFROM AND, TO THE MAXIMUM EXTENT ALLOWED BY LAW, NEITHER SHALL HAVE ANY LIABILITY OR RESPONSIBILITY FOR INJURY OR DAMAGES ARISING IN CONNECTION THEREWITH.