
Download Asset Allocation | November 2024
Here I Go Again (Whitesnake!)
Economic Update
Questions Around Where We Are, and Where We’re Going
By Regions Economic Division
One of the hard lessons we’ve learned from a lifetime of being somewhat, let’s say, navigationally challenged is that it’s hard to know where you’re going when you’re not sure where you are. There’s a certain uneasy feeling, with which we’re far too familiar, that comes with not being able to navigate a set course to a fixed destination. Lately, however, we’ve experienced that same feeling when trying to plot the course of the U.S. economy. Granted, the economy seldom, if ever, follows a set course, and its destination is never fixed, but there are times when one can at least be reasonably confident in their assessment of where the economy is and where it’s going. Now is not, at least for us, one of those times.
The final days of October and opening days of November brought a flurry of economic data releases that, if nothing else, reinforced the point that quantity does not necessarily bring clarity. Beyond what for some time has been a high degree of noise across much of the economic data, the signals being sent by the recent data have been further muddled by three factors: the effects of the Boeing strike, the effects of Hurricanes Helene and Milton, and questionable seasonal adjustment. We could easily add a fourth factor – uncertainty over the outcome of the elections – to that mix, as this had for some time been somewhat of a catch- all explanation for movements in the economic data and the financial markets. While any such uncertainty will begin to fade in the weeks and months ahead as the contours of fiscal, trade, and regulatory policy changes become more clear, that doesn’t necessarily help us answer the question of where we are today.
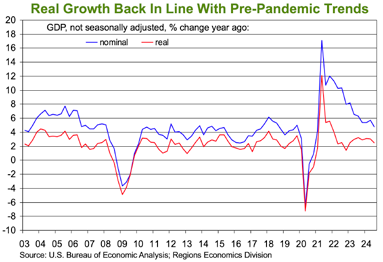
At first glance, much of the recent economic data suggest the U.S. economy is in a good place. For instance, the initial estimate from the U.S. Bureau of Economic Analysis (BEA) shows real GDP grew at an annual rate of 2.8% in Q3, not far off the 3.0% pace of growth seen in this year’s second quarter despite a wider trade deficit knocking six tenths of a percentage point off top-line real GDP growth. To that point, real private domestic demand – combined business and household spending – grew at an annual rate of 3.2% in Q3, better than either of the first two quarters of 2024. We do, however, have grounds to question whether the initial Q3 growth print overstates the case. For instance, real consumer spending is reported to have grown at a 3.7% pace in Q3, but the September data on consumer spending were significantly bolstered by favorable seasonal adjustment. We do not think underling growth in consumer spending to be as robust as implied by the Q3 GDP data and expect the Q4 data to show a meaningfully slower pace of growth.
The effects of the Boeing strike and Hurricanes Helene and Milton factored into the October employment report, to the point that the report says little, if anything, about underlying labor market conditions. In addition to the 33,000 Boeing workers on strike and, as such, not counted as employed in the establishment survey, significant numbers of those working for Boeing suppliers were sidelined in October. By our estimate, the strike deducted roughly 41,000 jobs from the October count of nonfarm payrolls. Moreover, the household survey data show that 512,000 people did not work during the October survey period due to adverse weather and that an additional 1.409 million people worked part-time hours rather than full-time hours due to adverse weather, each easily the highest counts on record for the month of October.
We’ll further note that the initial collection rate for the October establishment survey was only 47.4%, the lowest in any month since January 1991. Though October’s rate was clearly distorted by the hurricanes, persistently low survey collection rates go to the heart of our concerns over the reliability of estimates of nonfarm employment, hours, and earnings in any given month. The high degree of noise in the October data largely accounts for the notably muted reaction to the initial estimate showing nonfarm payrolls rose by only 12,000 jobs with private sector payrolls declining by 28,000 jobs. The low survey collection rate all but guarantees the November employment report will incorporate sizable revisions to these initial estimates.
The Federal Reserve estimates the Boeing strike knocked three tenths of a percentage point off the monthly change in industrial production in September, and the strike will act as a drag on the October industrial production data as well. To be sure, with the Boeing strike having ended in early November, industrial production will bounce back. These strike-related swings, however, should not deflect attention from what has been notable weakness in manufacturing output for the better part of the past two years. This is also seen in the data on orders for core capital goods, which have been strikingly rangebound since early 2023, and the Institute for Supply Management (ISM) Manufacturing Index, which has shown the manufacturing sector in contraction in 23 of the past 24 months.
Amid that streak, however, prices for non-labor inputs to production in the manufacturing sector have continued to push higher. Less surprising is that the same is true in the services sector, which, according to the ISM Non-Manufacturing Index, continues to expand at a steady pace. Continued increases in prices for non-labor inputs in the industrial and services sectors are a reminder that inflation, though having slowed significantly, is not going away quietly. Another, more visible, reminder is that core inflation as measured by the PCE Deflator, the Federal Open Market Committee’s preferred gauge of inflation, has been stuck at 2.7% in each of the past three months. Moreover, with base effects becoming more challenging, core PCE inflation will likely accelerate over the next few months.
It should be noted that, despite clearly cooling labor market conditions, several FOMC members have argued it would be premature to assume inflation is firmly on a path to the 2.0% rate targeted by the committee. Such concerns will likely be reinforced when accounting for potential policy implications of the November elections. With a starting point of the $1.8 trillion federal government budget deficit in fiscal year 2024, there are concerns that an even more expansionary fiscal policy mix could add to the deficit while buttressing inflation pressures. Moreover, the potential expansion of tariffs poses the threat of a “stagflationary” shock (i.e., lower growth, higher inflation). To be sure, it is too soon to know the specific paths to be set for fiscal, trade, and regulatory policy over coming months, but the broad contours have been fairly clearly telegraphed in advance.
Although the FOMC cut the Fed funds rate by 25 basis points at their early-November meeting, they offered little in the way of forward guidance, with Chair Powell sending no clear signals in his post-meeting press conference. Such vagueness, however, will not be an option at the December FOMC meeting, with the committee set to issue an updated set of economic and financial projections. The prospects of a more expansionary fiscal policy, expanded tariffs, and renewed wage pressures stemming from immigration reform could sustain inflation pressures and, in turn, limit the scope for further Fed funds rate cuts. To that point, we and many other analysts have dialed back our expectations for the number of funds rate cuts to be delivered through 2025. Market interest rates are likely to remain notably volatile as the policy landscape takes shape over coming months.
Through all the noise in the data, our assessment of where the economy is has remained largely unchanged. We continue to see the pace of economic activity as settling back toward the pre-pandemic trend rate, with the labor market continuing to cool but not collapsing, and core inflation as being more persistent than many had anticipated. Making these determinations is, at least in a relative sense, the easy part. What will be more difficult, even for those less navigationally challenged, in the weeks ahead will be processing how potentially significant changes in fiscal, trade, and regulatory policy; consumer and business confidence; and overall financial conditions will alter the path forward for the U.S. economy.
Sources: U.S. Bureau of Economic Analysis; U.S. Bureau of Labor Statistics; Federal Reserve Board; Institute for Supply Management
Investment Strategy Update
Stocks: Staying Positive into Year-End
Regions Multi-Asset Solutions & Highland Associates
U.S. large-cap stocks generated a negative return in October, with the S&P 500 dropping 1% to post the first losing calendar month for the index since April. Still, October’s drop provided little for investors to fret over, and we continue to see enough encouraging signs under the surface that leave us constructive on U.S. large caps into 2025. Some measures of market breadth or participation were deteriorating as November began, but 50% of S&P 500 constituents were trading above their 50-day moving average and 70% of the index still traded above their 200- day moving average at the time of this writing. It’s the latter of these two measures that we are paying the most attention to, as pullbacks in early August and again in early September were not accompanied by meaningful deterioration in the percentage of S&P 500 companies trading below their 200-day moving average. In hindsight, this was technically reason enough for investors to remain invested and in position to take advantage of subsequent sharp rebounds for stocks. So long as we continue to see 60% or more of the S&P 500 trading above their 200-day moving average, a more defensive or bearish stance on U.S. large-cap stocks likely won’t be rewarded.
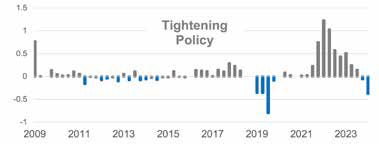
The November through January time frame has historically been the strongest consecutive three-month stretch for the S&P 500, and investors will likely be well served by positioning portfolios to take advantage of a more positive seasonal environment. The liquidity backdrop should also remain supportive of risk-taking as central banks across the globe ease monetary policy to varying degrees in the coming quarters, which should keep a bid under investment-grade and high- yield corporate bonds, along with stocks. Lastly, credit spreads on lower-quality corporate bonds remained tight as Treasury yields rose sharply throughout October, evidence that market participants appear to see few signs of economic turbulence on the horizon and remain willing to seek out higher expected returns in riskier asset classes as a result.
Developed Nations Around the Globe Easing Policy (Change in Developed Central Bank Rates)
Potential M&A Uptick in ’25 Reason Enough to Stay the Course with SMid
Small- and mid-cap (SMid) U.S. stocks have produced positive returns year-to-date, with the S&P Midcap 400 higher by 12.7% and the S&P Small Cap 600 turning out a less impressive 6.4% gain through October, each trailing the S&P 500’s 21% gain by a wide margin. Entering 2024, we were more constructive on SMid due to our belief that the FOMC would be easing monetary policy early in the year and that the U.S. economy could potentially reaccelerate as a result. But that’s not how the year initially played out as inflationary pressures remained sticky, preventing monetary policy authorities from easing sooner. Small caps finally rebounded after the FOMC cut the Fed funds rate by 50 basis points in September as investors expected a more aggressive pace of monetary policy easing to lower borrowing costs for smaller companies, which rely on shorter-term and/or floating rate debt. However, smaller companies have, so far, failed to see much benefit from rate cuts as bank lending standards have not yet begun to ease.
Small-cap stocks are often viewed as a higher beta way to play a reaccelerating U.S. economy due to larger exposures to economically sensitive sectors than the S&P 500. Given our view that the U.S. economy is settling back into a 2% GDP growth environment and is not on the cusp of reaccelerating, the economic backdrop isn’t likely to be supportive of small-cap outperformance in the near-term. However, an underweight position in small caps isn’t warranted either, as we expect a more relaxed regulatory regime with potential leadership changes at the Department of Justice and Federal Trade Commission to boost merger and acquisition (M&A) activity in the coming year(s), which should provide a floor of support for sectors such as financial services, healthcare, and industrials, among others, that are rife for consolidation and have been under a merger moratorium of sorts over the past four years.
Like the S&P Small Cap 600, the S&P Midcap 400 has substantial exposure to cyclical sectors such as consumer discretionary, financial services, and industrials but is made up of generally more established and higher quality companies with greater earnings visibility. Compared to the S&P 500, the 400 can provide portfolio diversification due to greater exposure to economically sensitive sectors and far less exposure to communication services and information technology, which have powered the S&P 500 higher in recent years. While we see SMid as a mixed bag over the near-term, we maintain exposure to both small- and mid-cap stocks in line with our strategic target allocation. Investors that have been rewarded for carrying higher weights in U.S. large-cap stocks in recent years may want to consider reallocating or rebalancing after another year of outsized S&P 500 performance in advance of what could be an active environment for M&A activity in the coming year.
U.S. Election Outcome Clouds the Near-Term Outlook for Markets Abroad
Foreign stock markets don’t usually perform well on a relative basis when the U.S. dollar (USD) is strengthening. A stronger dollar generally signals that either U.S. economic growth is expected to outpace growth abroad to the point that foreign investors are increasing exposure to dollar-denominated assets to take advantage of stronger U.S. growth, or that capital is flowing into the U.S. from abroad as a defensive or de-risking move. In October, the U.S. Dollar Index, or DXY, posted its largest monthly gain in over a year, rising from $100.78 to $103.98, due in part to markets pricing in some combination of faster U.S. growth and higher inflation as polling data pointed toward a higher probability of a “red sweep,” which is what materialized. Political uncertainty may have lessened stateside, but the impact of policy uncertainty stemming from the election on our trading partners can’t yet be fully understood and priced in.
The election outcome is likely to weigh on investor sentiment surrounding both developed and developing markets abroad over the near-term as uncertainty lingers well into 2025. With global liquidity likely to rise into year- end as central banks ease monetary policy, capital is more likely to make its way into the U.S., buoying U.S. large caps first and foremost, followed by U.S. SMid, as a play on an improved U.S. economic outlook. The potential for more protectionist U.S. trade policies, including expanding tariffs on a broader swath of imports from China, the Eurozone, and Mexico, could pose a headwind for foreign stocks well into 2025 and could buoy the U.S. dollar until some degree of comfort surrounding the path forward on the trade front can be achieved.
Investment Strategy Update
Bonds: Treasuries, High-Quality Corporates Worth a Look After the Backup in Yields
Regions Multi-Asset Solutions, Highland Associates
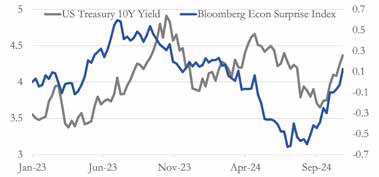
Last month ended a profitable four-month stretch for fixed income investors as yields on higher-quality fixed-income instruments rose sharply during October as fears of a U.S. economic slowdown or recession subsided due in large part to a series of stronger than anticipated economic data releases. For some context, the 10-year U.S. Treasury yield fell from 4.50% at the end of May down to 3.80% at the end of September, generating a 6.2% return out of the Bloomberg Aggregate Bond Index (AGG) over that time frame. But yields reversed course during October, and the 10-year yield ended the month just shy of 4.30%, leading to 2.2% and 2.3% drops in the Bloomberg U.S. Aggregate Bond Index and the Bloomberg U.S. Corporate Bond Index.
10-Year Yield Responding to Positive Economic Surprises
Source: Bloomberg
The 10-year U.S. Treasury holds far greater appeal now with a yield hovering around 4.4% than when the yield dipped down to around 3.6% in mid-September, but there are a few variables we believe could keep upward pressure on yields. Sovereign bond yields in the U.K. and Germany have been rising after the U.K.’s budget proposal included more gilt issuance than expected, and this could keep yields on long- dated U.S. Treasuries anchored near current levels into 2025. Stateside, uncertainty surrounding the U.S. potentially levying tariffs on a broader set of imported goods in the coming year is unlikely to dissipate over the near-term and may limit downside for yields. Also worth noting: The U.S. Treasury is potentially set to issue a larger percentage of notes and bonds in the coming year after a preference for shorter-dated bills in recent quarters. Even if one expects yields to rise, it might still make sense for income-seeking investors to consider adding exposure to longer-term bonds to lock in these higher rates, but we would advise doing so at a measured pace given our expectation that yields could continue to climb over the near-term. This backdrop should also provide opportunities for investors to extend portfolio duration over time as opposed to deploying cash all at once, and a continued rise in Treasury yields should present investors with higher yields in investment-grade corporate bonds as well, should volatility bring about valuation dislocations along the way.
‘Non-Core’ Crowded, But ‘Carry’ Is Still King
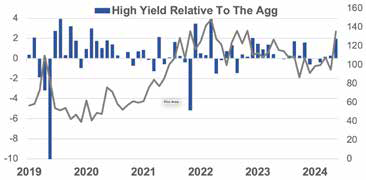
In October, rising rates were a drag on fixed-income returns, but credit fared best, as evidenced by the Bloomberg High Yield Index declining by 0.5% and easily outperforming the Aggregate Bond index by just shy of 2% on the month. High yield served as a nice diversifier for bond portfolios amid the backup in yields last month, a trait that tends to get overlooked when investors look to de-risk portfolios in more uncertain times as higher yields, shorter durations, and correlations take a back seat to overreaction. Another consideration for investors in core fixed income, specifically U.S. Treasuries, is growing concern surrounding larger government budget deficits. Shorter duration bonds such as corporate high yield are somewhat removed from deficit concerns due to their lower sensitivity to rising long-term Treasury yields. However, valuations for corporate high yield remain stretched, and credit spreads have consistently tightened, reducing the expected return for taking on credit risk in this segment of the fixed income market. Despite lofty valuations, we don’t advise waiting on the sidelines as yield and diversification benefits from investing in corporate bonds more than offset valuation concerns at the present time.
U.S. dollar denominated emerging market bonds returns landed between core bonds and U.S. high yield in October, with the Bloomberg USD EM Debt Index falling by 1.4%. Shifts in the macroeconomic environment created volatility, and portfolio de-risking dominated as a result. Emerging economies have moved mountains from a fiscal and monetary policy perspective in recent years, but higher domestic interest rates may be required to stabilize local currencies and could hamper growth and weigh on prices of stocks and bonds tied to developing nations over the near-term. For now, we would wait for the dust to settle as rising interest rates and macroeconomic forces could be temporarily punishing these bonds unfairly relative to fundamentals, potentially creating opportunities for active investors to find diamonds in the rough.
High Yield Has Fared Far Better Than ‘Core’ as Rate Volatility Has Ramped Up
Source: Bloomberg
IMPORTANT DISCLOSURES: This publication has been prepared by the staff of Highland Associates, Inc. for distribution to, among others, Highland Associates, Inc. clients. Highland Associates is registered with the United States Security and Exchange Commission under the Investment Advisors Act of 1940. Highland Associates is a wholly owned subsidiary of Regions Bank, which in turn is a wholly owned subsidiary of Regions Financial Corporation. Research services are provided through Multi-Asset Solutions, a department of the Regions Asset Management business group within Regions Bank. The information and material contained herein is provided solely for general information purposes only. To the extent these materials reference Regions Bank data, such materials are not intended to be reflective or indicative of, and should not be relied upon as, the results of operations, financial conditions or performance of Regions Bank. Unless otherwise specifically stated, any views, opinions, analyses, estimates and strategies, as the case may be (“views”), expressed in this content are those of the respective authors and speakers named in those pieces and may differ from those of Regions Bank and/or other Regions Bank employees and affiliates. Views and estimates constitute our judgment as of the date of these materials, are often based on current market conditions, and are subject to change without notice. Any examples used are generic, hypothetical and for illustration purposes only. Any prices/quotes/statistics included have been obtained from sources believed to be reliable, but Highland Associates, Inc. does not warrant their completeness or accuracy. This information in no way constitutes research and should not be treated as such. The views expressed herein should not be construed as individual investment advice for any particular person or entity and are not intended as recommendations of particular securities, financial instruments, strategies or banking services for a particular person or entity. The names and marks of other companies or their services or products may be the trademarks of their owners and are used only to identify such companies or their services or products and not to indicate endorsement, sponsorship, or ownership by Regions or Highland Associates. Employees of Highland Associates, Inc., may have positions in securities or their derivatives that may be mentioned in this report. Additionally, Highland’s clients and companies affiliated with Highland Associates may hold positions in the mentioned companies in their portfolios or strategies. This material does not constitute an offer or an invitation by or on behalf of Highland Associates to any person or entity to buy or sell any security or financial instrument or engage in any banking service. Nothing in these materials constitutes investment, legal, accounting or tax advice. Non-deposit products including investments, securities, mutual funds, insurance products, crypto assets and annuities: Are Not FDIC-Insured I Are Not a Deposit I May Go Down in Value I Are Not Bank Guaranteed I Are Not Insured by Any Federal Government Agency I Are Not a Condition of Any Banking Activity.
Neither Regions Bank nor Regions Asset Management (collectively, “Regions”) are registered municipal advisors nor provide advice to municipal entities or obligated persons with respect to municipal financial products or the issuance of municipal securities (including regarding the structure, timing, terms and similar matters concerning municipal financial products or municipal securities issuances) or engage in the solicitation of municipal entities or obligated persons for such services. With respect to this presentation and any other information, materials or communications provided by Regions, (a) Regions is not recommending an action to any municipal entity or obligated person, (b) Regions is not acting as an advisor to any municipal entity or obligated person and does not owe a fiduciary duty pursuant to Section 15B of the Securities Exchange Act of 1934 to any municipal entity or obligated person with respect to such presentation, information, materials or communications, (c) Regions is acting for its own interests, and (d) you should discuss this presentation and any such other information, materials or communications with any and all internal and external advisors and experts that you deem appropriate before acting on this presentation or any such other information, materials or communications.
Source: Bloomberg Index Services Limited. BLOOMBERG® is a trademark and service mark of Bloomberg Finance L.P. and its affiliates (collectively “Bloomberg”). BARCLAYS® is a trademark and service mark of Barclays Bank Plc (collectively with its affiliates, “Barclays”), used under license. Bloomberg or Bloomberg’s licensors, including Barclays, own all proprietary rights in the Bloomberg Barclays Indices. Neither Bloomberg nor Barclays approves or endorses this material or guarantees the accuracy or completeness of any information herein, or makes any warranty, express or implied, as to the results to be obtained therefrom and, to the maximum extent allowed by law, neither shall have any liability or responsibility for injury or damages arising in connection therewith.