
Download Asset Allocation | August 2024
Tightrope
Economic Update
So, “Suddenly” Is Suddenly Here?
By Regions Economic Division
In a decidedly less interesting book, Bill Gorton’s question might have been “How do expansions end?” And while Mr. Hemingway, thankfully, opted to go a different route, Mike Campbell’s reply would have been the same: “Two ways. Gradually, then suddenly.” While history may, as we expect will be the case, prove otherwise, it sure seemed like “suddenly” got here at 8:30 a.m. on August 2 in the form of the July employment report. The report showed a marked slowdown in nonfarm job growth, a jump in the unemployment rate, a drop in average weekly hours, and a deceleration in wage growth. That the July employment report is deeply flawed seemed, with an assist from the Bureau of Labor Statistics (BLS), to have gone largely overlooked, as it triggered a stunning decline in yields on U.S. Treasury securities, a sharp sell-off in equities, and a chorus of recession calls, many of which came from analysts whose calls had been different at 8:29 a.m. on August 2.
Suddenly, indeed. It is more than fair to ask whether the economy was really any different at 8:31 a.m. on August 2 than it was at 8:29 a.m. on August 2. To help set the stage for this discussion, recall that the July Federal Open Market Committee (FOMC) meeting concluded two days prior to the release of the July employment report. As was widely expected, the FOMC left the Fed funds rate unchanged but set the stage for a 25-basis-point cut in the funds rate at their September meeting, an outcome that markets, and most analysts, seemed to have taken in stride. The following day, however, brought the July ISM Manufacturing Survey, which showed the manufacturing sector in contraction for the 20th time in the past 21 months, and the weekly data on initial claims for unemployment insurance, which showed the highest number of filings since last August.
Between initial jobless claims and the ISM Manufacturing Index, markets were already on edge on Thursday, August 1, with equity prices and yields on U.S. Treasury securities dropping during the day. That set the stage for what took place in the aftermath of the release of the July employment report the following day. Kind of. We can at least understand the reaction in equity markets, where many had for some time been expressing concerns that valuations may be on the lofty side. As such, the prospect of the economy shifting into a slower pace of growth would have meant that some resetting of valuations was in order, particularly among the tech giants. So, one could argue that while the stage was set for a pullback in equity prices, the only thing missing was a catalyst, which apparently arrived at 8:30 a.m. on August 2.
Still, that pullback was almost surely intensified by a number of analysts reacting to the July employment report by making sudden and sharp changes to their forecasts of the paths of monetary policy and the broader economy. For instance, many who prior to the release of that report had a “soft landing” scenario and 50 basis points of Fed funds rate cuts by year-end as their base case suddenly pivoted to recession calls and forecasts of 125 basis points, or more, of funds rate cuts by year-end, with some going as far as to call for the FOMC to implement a 50-basis-point cut prior to the September FOMC meeting. Such pivots added to worries over economic growth, which contributed to the steep decline in yields on U.S. Treasury securities on August 2.
While the sell-off in equities was at least to some extent understandable, the reaction among those analysts making sharp and sudden pivots in their forecasts was, and remains, somewhat puzzling. Aside from the July employment report clearly being riddled with noise which, the BLS’s assertion to the contrary, includes meaningful impacts from Hurricane Beryl, signs of a slowing pace of economic growth did not suddenly materialize during the first few days of August. Indeed, we have for some time now been pointing to what we have seen as clear signs of a slowing pace of economic growth. We have for even longer been pointing to cooling demand for labor while noting that numerous collection/measurement issues have made the monthly employment reports less reliable snapshots of labor market conditions.
That the ISM’s July survey showed the manufacturing sector in contraction was nothing new. Moreover, at 46.8% in July, the headline index remained above 42.5%, which ISM pegs as the line between contraction and expansion in the broader economy, a line that the headline index has not come close to crossing during this 21-month run of weakness. As for the data on initial jobless claims, the increase to a nearly one-year high fueled concerns of a pronounced deterioration in labor market conditions, as if “gradually” might be turning into “suddenly.” We did not think too much of the increase in initial claims; not only were claims still being inflated by increased filings in Texas in the wake of Hurricane Beryl, but also the pattern in claims over the prior several weeks was in keeping with the summer spikes seen over the past few years, spikes which receded in subsequent weeks, suggesting issues with the seasonal adjustment process. To that point, over the final two weeks of July, the net change in not seasonally adjusted claims was minus 64,728, while the net change in seasonally adjusted claims was plus 4,000.
As for the July employment report, though the BLS stated that Hurricane Beryl had “no discernible effect” on the July data, the data seem to say otherwise. The household survey data show 436,000 people did not work at all during the July survey period due to adverse weather, while 1.079 million people who normally work full-time worked only part-time due to adverse weather. At the same time, the number of people who reported being on “temporary layoff” rose by 249,000 in July, the largest increase since the early stages of the pandemic, which added two-tenths of a point to the July unemployment rate, i.e., the reported increase from June. Moreover, unlike the household survey, the establishment survey requires one be physically present at work at some point during the survey period to be counted as employed. The spike in initial claims for unemployment insurance benefits in Texas in the weeks after Hurricane Beryl suggests the July count of nonfarm payrolls was held down by Beryl.
Is This a Sustainable Fiscal Path?
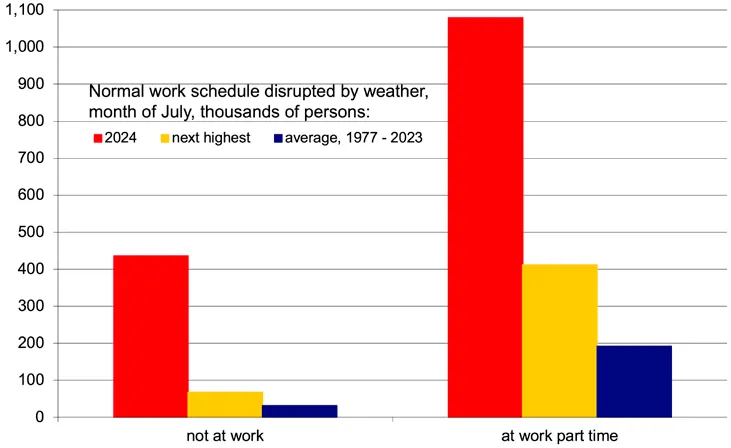
Source: U.S. Bureau of Labor Statistics; Regions Economics Division
In short, neither how we analyze the economic data nor how we see the economy evolving was any different at 8:31 a.m. on August 2 than it was at 8:29 a.m. on August 2. Our base case has been, and remains, that after the significant distortions in economic activity over the past few years wrought by the pandemic and the policy response to it, the pace of economic activity is reverting toward the roughly 2% trend rate seen over the decade prior to the pandemic.
To be sure, it is more than fair to ask whether that “normalization” is what we are now seeing or whether/to what extent the added burdens of a prolonged period of rapidly rising prices and higher interest rates will push the economy past that point – to the downside, that is. It is, however, also more than fair to ask what could possibly have changed so dramatically and what was suddenly seen on 8:30 a.m. on August 2 that wasn’t visible at 8:29 a.m. on August 2 to warrant the sharp and sudden pivots made by many analysts after the release of the July employment report.
Time will tell whose calls on the economy are closer to the mark. For now, however, it could be that enough FOMC members interpreted the July employment report as a warning that policy is too restrictive and, as such, now feel a more aggressive course of Fed funds rate cuts is in order. To that point, we have added a third 25-basis-point funds rate cut to the baseline forecast (the November FOMC meeting). This, however, would reflect the FOMC making policy less restrictive at a faster pace, reflecting progress on inflation and slowing growth, as opposed to the FOMC shifting to an accommodative policy stance to fend off recession.
Sources: U.S. Bureau of Labor Statistics; Institute for Supply Management
U.S. Public Policy Update
Regions Government Affairs
With November’s elections less than 90 days away, and the issue of the balance of power in Washington still anyone’s guess, we have been considering questions from clients as to what will shape the next few years in policy, politics, and the economy.
No matter who wins the White House, House, and Senate, those in power will be faced with a series of truly must- manage items in 2025. The next President and legislative leaders will be forced to deal with an expiring debt limit (sometime in the spring/summer), as well as the expirations of parts of the Tax Cuts and Jobs Act (TCJA) and certain Affordable Care Act (ACA) subsidies, both at the end of the year.
As a ticket, VP Harris and Governor Walz have not set forth any detailed financial services policies of note, which tracks with their prior experience in politics, which was largely focused away from financial matters. Governor Walz has signed state-level legislation that included down payment assistance for home purchases, aligning his gubernatorial record with progressive proposals from legislators in Washington. As such, a Harris-Walz White House would likely enjoy influence from progressive legislators of influence (Senators Warren, Sanders, etc.).
To be sure, the outcome of the Presidential election will have great influence on the direction the efforts to manage these multiple fiscal cliffs take, but the power balance in the House and Senate will be equally important in these discussions, as these matters will be handled in the legislative body and require Presidential approval. If one party has singular control over the Oval Office and both chambers of Congress, there will almost certainly be a major effort to draft sweeping economic legislation that hews closely to partisan policy wish lists. Should there be divided government, the likelihood of major fiscal legislation diminishes significantly, an outcome that markets generally prefer.
Looking at the looming TCJA cliff, a detailed discussion on taxes is hard to come by on the campaign trail as it is not a policy item that fits neatly into a sound bite given the number of details that lie beneath the surface of the issue. But indications from former President Trump are that he would seek to reduce both individual and corporate tax rates (the latter to as low as 15%) in a second term. Should VP Harris be elected, expectations are that she would carry forward President Biden’s pledge not to raise taxes on individuals earning less than $400k annually and may seek to expand on social items such as the childcare tax credit from the Inflation Reduction Act. To do so, Harris would likely seek to raise further revenue through increased corporate taxes, changes to certain tax treatments around trusts for ultra-high net worth individuals, and some form of minimum tax on billionaires, among other items.
There is also no conviction that either party will stem the tide in government spending when they take power in 2025, but there are signs that major spending bills might face challenges to passage even in the case of a single party holding all the cards. Former President Trump pledged to eliminate the national debt in eight years when he was campaigning in 2016 (that didn’t happen), but should he win in November and seek to enact those tax cuts, there is a growing sentiment from a group of conservative fiscal hawks in the GOP that all such bills must be fully offset (i.e., paid for). The GOP would seek to do so by clawing back certain expenditures from President Biden’s Inflation Reduction Act, trimming social programs, and other measures. But with the deficit currently at $1.9 trillion (24.2% of GDP) and debt servicing approaching 2.5% of GDP, there is a feeling that much more significant measures are required for the fiscal health of the country in the longer term.
With budget deficits expected to grow significantly over the next two decades, elected leaders may need to make unpopular – but necessary – decisions to reverse the spending trend.
Investment Strategy Update
Stocks: Range-Bound Between Now and November?
Regions Multi-Asset Solutions & Highland Associates
July brought with it a bout of sector rotation as investors took profits and trimmed positions in the “Magnificent 7” for the first time since Q2 2023, redeploying proceeds into value-oriented sectors and U.S. small-cap stocks. As a result of this powerful position unwind, the S&P 500 information technology sector, which had provided consistent market leadership dating back to last October, fell 3.2% on the month. Conversely, the S&P 500 consumer discretionary, financial services, health care, industrials, materials, real estate, and utilities sectors each ended the month higher by 2.5% or more, while the S&P Small Cap 600 index rallied just shy of 11% as Treasury yields fell and Q2 real GDP growth came in above expectations. We view this portfolio repositioning or recalibration favoring value and small caps as a healthy and long overdue event.
As a result of this rotation, market breadth improved, putting U.S. equities on firmer footing while resetting expectations and valuations for many of the U.S. large-cap names, specifically the Magnificent 7. The equally weighted S&P 500 outpaced the market-capitalization weighted S&P 500 by over 4% during July (+4.4% versus 1.2%), and with over 70% of S&P 500 constituents trading above their respective 10-day, 50-day, and 200-day moving averages at month- end, we were encouraged that the market remained on firm footing. That view was called into question in August as a broad-based sell-off on economic growth concerns put the S&P 500 on the cusp of correction territory, defined as a peak-to-trough decline of 10% or more.
As the Magnificent 7 pared gains in the back half of July, the S&P 500 barely wobbled as economically and interest rate sensitive sectors picked up the slack. But that dynamic has shifted in August as economic growth concerns have led to selling of cyclical stocks in the financial services, industrials, and materials sectors. Defensive areas such as consumer staples, health care, real estate, and utilities have held up relatively well during the recent pullback, but at less than one quarter of the index, these sectors alone aren’t large enough to prop up the broader market. From a technical perspective, the S&P 500 traded below both its 50- and 100-day moving average at the time of this writing, and after breaking below those support levels, holding above the 200-day moving average around 5,015 becomes imperative to avoid a deeper drawdown. The technical damage done to the S&P 500 in the recent pullback needs time to repair itself, and as a result the index could be range-bound, potentially stuck between its 100-day and 200-day moving average as the calendar historically turns unkind for stocks in the August through October window.
The elephant in the room in the coming months will be U.S. elections. Providing some historical context around what might materialize marketwise could be valuable for those thinking of altering their plan in the interim. Since 1980, the S&P 500 has ended August with a gain in 8 of the past 11 presidential election years, generating an average return of just north of 2%, while September and October have indeed provided tougher sledding as investors move to the sidelines in the lead-up to Election Day. Over that same time period, during presidential election years the S&P 500 has produced an average return of 2.6% from the start of November through year-end and has finished with a gain 8 out of 11 times. A solid batting average with investors compensated for staying the course and tuning out election-related noise. Politics will increasingly dominate headlines as we approach November 5th, but investors able to put blinders on and look past near-term political uncertainty should be rewarded, regardless of how the balance of power in Washington, D.C., ultimately shakes out.
Valuations, Fed Easing Reasons to Allocate to SMid
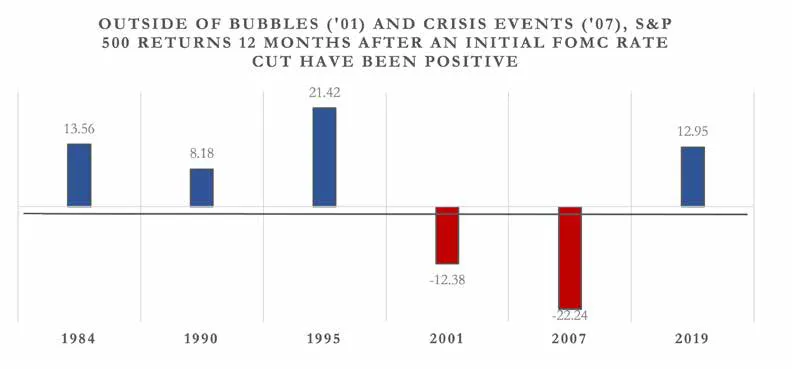
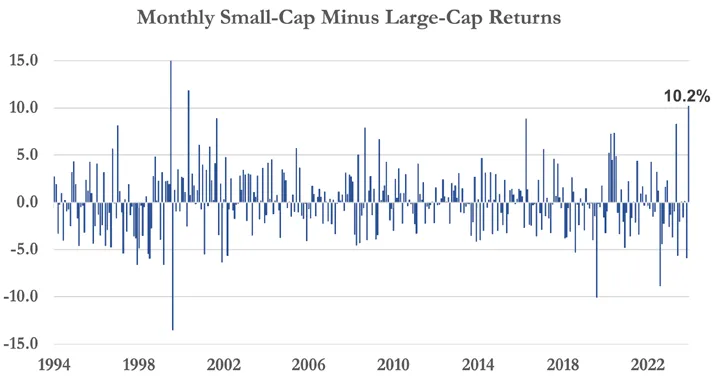
After lagging large caps for the first half of 2024, the S&P Small Cap 600 index garnered headlines last month by generating a 10.8% return and outperforming the S&P 500 by 9.6%. Notably, July marked just the third month in the last 30 years where small caps outperformed large caps by over 9%. The two prior instances when this occurred were around the bursting of the dot-com bubble in 2000, with small caps outperforming over the next 12 months in both instances. There are reasons why the current market environment likely won’t rhyme with what took place around the dot-com bubble, but that historical comparison may shed some light on the recent rotation into small-cap stocks as a valuation gap well above historical norms existed then too. In 2000, the S&P 500 traded at a trailing price-to-earnings ratio of 29.9 times, while the S&P 600 traded at 25.3, a gap of 4.6 multiple points. This compares to a valuation gap of 5.6 multiple points at the end of July as the S&P 500 traded at 22.8 times expected 2024 earnings and the S&P 600 traded at 17.2 times. Small caps had a relative valuation advantage in both environments, but the washout that followed in 2000 also reset risk sentiment, something we would be looking for to give small- and mid-cap stocks a sustainable advantage this time around as well. Should economic growth concerns prove fleeting as the FOMC eases monetary policy in the coming months, investors may once again price smaller companies based on their improving fundamentals, which is ultimately the long- term driver of returns.
Source: Bloomberg
Currency, Economic Growth, and Geopolitical Concerns Spur a Rotation Abroad as Well
Developed markets outperformed emerging markets during July as developing country indices with heavy concentrations in semiconductors (South Korea, Taiwan) that had benefitted from the rise of artificial intelligence (AI) fell in sympathy with the Magnificent 7 in the U.S. Developed markets abroad with less exposure to technology-related industries held up well on a relative basis with Italy, Spain, and the United Kingdom notable outperformers. After performing well over the past year and year-to-date, Japanese stocks took a breather as the country’s currency, the Japanese yen, continued to slide versus the U.S. dollar. This led to calls for the Bank of Japan (BoJ) to intervene and raise policy rates to support the currency, which did occur on July 31. A stronger yen would, on balance, be a headwind for the country’s export-heavy economy and heavyweights such as Toyota, Sony, and Hitachi, among others. But even with the yen strengthening at month- end, by historical standards it is still relatively weak versus the U.S. dollar. Developed markets abroad are likely to remain a mixed bag over the near-term with euro area equities receiving a boost from less- restrictive monetary policy, while Japanese stocks could remain volatile as the BoJ tries to get control of the yen. This backdrop leaves us neutral on international developed market stocks.
On the emerging markets front, most of the other country indices that performed well in July had lagged year-to-date as investors favored exposure to tech- heavy countries, with South Korea and Taiwan two of the bigger beneficiaries of the rise of AI. However, rising geopolitical fears led to profit taking in country indices tied to China, South Korea, and Taiwan during the month as the Biden administration considered additional restrictions on sales of semiconductor chips to China and former President Trump commented that the U.S. should receive compensation for defending Taiwan against China’s advances. Investors priced in the prospect of semiconductor sales to China falling more in the coming quarters and that the semiconductor industry’s reliance on Taiwan could be a bigger choke point than many previously anticipated. The risk that China will move on Taiwan is ever present, but with shares of most semiconductor stocks now down 10%- 20% from year-to-date highs reached in early July, that risk is now more appropriately priced and could set up a bounce in South Korea and Taiwan, specifically, which would boost the MSCI EM index.
Bonds: Safety Bid Under Treasuries Could Persist
Regions Multi-Asset Solutions, Highland Associates
Treasury yields across the curve have moved sharply lower since the start of July. The U.S. Treasury yield curve steepened throughout much of the month as the likelihood the FOMC would cut rates in September increased, attempting to end one of the longest yield curve inversions in history. The yield on 10-year U.S. Treasury notes was only 22 basis points above the yield on 2-year notes at month-end, and that spread has narrowed further in August and hovered closer to 10 basis points at the time of this writing. The shrinking spread between those two often-quoted maturities is the narrowest it has been since July of 2022, the same month the current curve inversion began.
Historically, the yield curve normalizing has been viewed as an ominous sign for markets and central bankers as it has signaled that monetary policy needs to become more accommodative to stimulate economic growth and avoid recession. But the recent track record for this indicator has been spotty and a poor market timing tool. There is little in the economic data at present to indicate a U.S. recession is in the offing, but we are entering a notoriously tough stretch in the calendar for stocks and riskier assets from August through October, and interest rate volatility is likely to remain elevated as a result.
The move lower in Treasury yields is understandable given rising geopolitical tensions, but absent a panicked FOMC aggressively cutting rates in the coming months and/or a U.S. recession materializing, which we don’t anticipate, the magnitude of the move lower isn’t likely to be sustained. However, with economic, political, and geopolitical uncertainty heightened in the coming months, upside for Treasury yields could be limited in the near-term with 4% a potential area of resistance for both 2- and 10-year Treasury yields. With yields falling sharply across the Treasury curve in July, most tenors now appear “rich,” and while we slightly favor shorter-term Treasuries given our view that recession concerns are overblown, we aren’t convicted enough in that view to deviate from our preferred strategic positioning, which is a duration profile in line with that of the Bloomberg Aggregate Bond index.
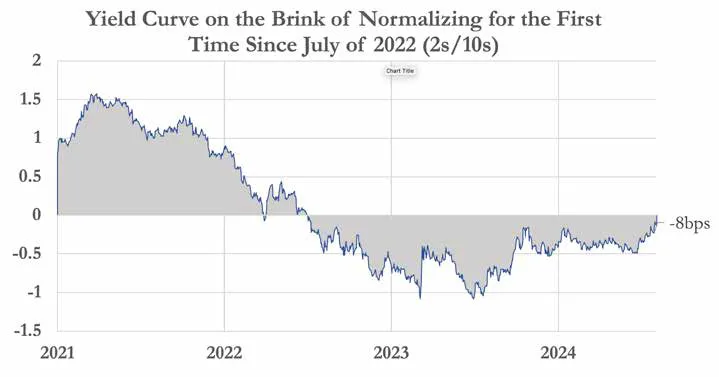
Source: Bloomberg
Corporate Credit a Relatively Good Place to Be, but We Don’t Want to Overstay Our Welcome
Corporate borrowers were active in the lead-up to
the FOMC’s meeting on July 30–31, bringing $32B in
corporate bonds to market in the two days preceding
the committee’s decision on rates mid-week. The flurry of
corporate issuance, along with fears of a U.S. economic
slowdown building, forced credit spreads on corporate
bonds wider during the first week of August to levels last
seen in November of 2023. At the time of this writing,
the Bloomberg U.S. Corporate and U.S. Corporate
High Yield indices carried a yield-to-worst of 5% and
7.80%, respectively, which is far from a screaming buy
by historical standards when viewed in isolation but
remains attractive relative to other segments of the
fixed income market, specifically, Treasuries. Investment-
grade corporate bonds should benefit even if Treasury
yields fall further due to their longer duration profile, while
also faring well versus Treasuries if growth concerns fade.
High-yield corporate bonds are more susceptible should
the economic outlook deteriorate, as issuers are more
negatively impacted from a lack of available credit;
but with credit spreads now just back to levels seen in
early January, we aren’t yet seeing signs that the panic
selling in stocks has spread to riskier corporate bonds,
leading us to view this pullback as healthy and more of
an opportunity than a cause for concern.
IMPORTANT DISCLOSURES: This publication has been prepared by the staff of Highland Associates, Inc. for distribution to, among others, Highland Associates, Inc. clients. Highland Associates is registered with the United States Security and Exchange Commission under the Investment Advisors Act of 1940. Highland Associates is a wholly owned subsidiary of Regions Bank, which in turn is a wholly owned subsidiary of Regions Financial Corporation. Research services are provided through Multi-Asset Solutions, a department of the Regions Asset Management business group within Regions Bank. The information and material contained herein is provided solely for general information purposes only. To the extent these materials reference Regions Bank data, such materials are not intended to be reflective or indicative of, and should not be relied upon as, the results of operations, financial conditions or performance of Regions Bank. Unless otherwise specifically stated, any views, opinions, analyses, estimates and strategies, as the case may be (“views”), expressed in this content are those of the respective authors and speakers named in those pieces and may differ from those of Regions Bank and/or other Regions Bank employees and affiliates. Views and estimates constitute our judgment as of the date of these materials, are often based on current market conditions, and are subject to change without notice. Any examples used are generic, hypothetical and for illustration purposes only. Any prices/quotes/statistics included have been obtained from sources believed to be reliable, but Highland Associates, Inc. does not warrant their completeness or accuracy. This information in no way constitutes research and should not be treated as such. The views expressed herein should not be construed as individual investment advice for any particular person or entity and are not intended as recommendations of particular securities, financial instruments, strategies or banking services for a particular person or entity. The names and marks of other companies or their services or products may be the trademarks of their owners and are used only to identify such companies or their services or products and not to indicate endorsement, sponsorship, or ownership by Regions or Highland Associates. Employees of Highland Associates, Inc., may have positions in securities or their derivatives that may be mentioned in this report. Additionally, Highland’s clients and companies affiliated with Highland Associates may hold positions in the mentioned companies in their portfolios or strategies. This material does not constitute an offer or an invitation by or on behalf of Highland Associates to any person or entity to buy or sell any security or financial instrument or engage in any banking service. Nothing in these materials constitutes investment, legal, accounting or tax advice. Non-deposit products including investments, securities, mutual funds, insurance products, crypto assets and annuities: Are Not FDIC-Insured I Are Not a Deposit I May Go Down in Value I Are Not Bank Guaranteed I Are Not Insured by Any Federal Government Agency I Are Not a Condition of Any Banking Activity.
Neither Regions Bank nor Regions Asset Management (collectively, “Regions”) are registered municipal advisors nor provide advice to municipal entities or obligated persons with respect to municipal financial products or the issuance of municipal securities (including regarding the structure, timing, terms and similar matters concerning municipal financial products or municipal securities issuances) or engage in the solicitation of municipal entities or obligated persons for such services. With respect to this presentation and any other information, materials or communications provided by Regions, (a) Regions is not recommending an action to any municipal entity or obligated person, (b) Regions is not acting as an advisor to any municipal entity or obligated person and does not owe a fiduciary duty pursuant to Section 15B of the Securities Exchange Act of 1934 to any municipal entity or obligated person with respect to such presentation, information, materials or communications, (c) Regions is acting for its own interests, and (d) you should discuss this presentation and any such other information, materials or communications with any and all internal and external advisors and experts that you deem appropriate before acting on this presentation or any such other information, materials or communications.
Source: Bloomberg Index Services Limited. BLOOMBERG® is a trademark and service mark of Bloomberg Finance L.P. and its affiliates (collectively “Bloomberg”). BARCLAYS® is a trademark and service mark of Barclays Bank Plc (collectively with its affiliates, “Barclays”), used under license. Bloomberg or Bloomberg’s licensors, including Barclays, own all proprietary rights in the Bloomberg Barclays Indices. Neither Bloomberg nor Barclays approves or endorses this material or guarantees the accuracy or completeness of any information herein, or makes any warranty, express or implied, as to the results to be obtained therefrom and, to the maximum extent allowed by law, neither shall have any liability or responsibility for injury or damages arising in connection therewith.