
Download Asset Allocation | June 2024
Cool Change
Economic Update
Lots of Noise, Little in the Way of Change
By Regions Economic Division
One of the best pieces of investment advice we’ve ever come across is “don’t make short-term judgments about long- term assets.” If there were a corollary to apply to our task of economic analysis and forecasting, it would be along the lines of “don’t make long-term judgments about short-term moves in the data.” To be sure, giving advice is often much easier than following advice, but it is nonetheless striking to us how so many analysts and market participants seem inclined to treat each and every new data point as a stand-alone statement of underlying economic conditions. Even worse, it seems that of late the reaction to each new data point is couched in terms of whether that data point makes it more/less likely the FOMC will cut the Fed funds rate sooner/later. One can make a case that enough market participants viewing each and every data release through this narrow prism has been a prime factor behind what has been considerable volatility in equity prices and yields on fixed-income securities while doing nothing to advance anyone’s understanding of the state of the U.S. economy.
Those who have followed us for any length of time know that our reactions to the economic data releases tend to be considerably more tempered. After all, the narrative of an economy as large as the U.S. economy doesn’t change from one month to the next, let alone from one data release to the next, the obvious exception being the onset of a global pandemic. Recall that the general theme of our commentary in last month’s edition was “appearances can be, and often are, deceiving.” We noted that much of the data for the month of April suggested a marked slowdown in the pace of economic activity, and while we did indeed think the economy to be slowing, we thought the April economic data were overstating the degree to which that was the case. That included an April employment report which showed a significant slowdown in job and wage growth, and the ISM’s surveys of the manufacturing and services sectors, both of which were shown to have slipped into contraction in April. To our earlier point, the reaction to seemingly soft economic data for the month of April was along the lines of “bad news is good news,” in that the April economic data were generally seen as making Fed funds rate cuts more likely.
As for us, in keeping with one of our fundamental tenets – for any given data release, the headline number is the least important number as the real story is told by the details – we decided to let the details of the data releases do the talking. As we discussed last month, the details of the April data led us to conclude that the economy was not slowing to the extent implied by many of the headline numbers, with measurement/ collection issues and punitive seasonal adjustment the source of much of what we saw as false signals. The one thing we could be sure of was that it wouldn’t take long for us to know whether our assessment was on base or off the mark, with the May economic data delivering the verdict.
After having slipped to 49.4 percent in April, the ISM Non-Manufacturing Index bounced back to 53.8 percent in May. While any reading below 50.0 percent indicates contraction, it was hard to make a plausible case that the broad services sector actually fell into contraction in April, particularly with continued growth in new orders. The ISM’s May survey put that notion to rest, showing a significant increase in business activity and a seventeenth straight month of orders growth. Still, the ISM Manufacturing Index remained below 50.0 percent in May while new orders fell for a second straight month, but at the same time the survey results indicated growth in employment and output while comments from survey respondents were split between those indicating growth and those indicating softening demand.
This is a useful reminder that, at any given time, not all industry groups within a broad sector, whether manufacturing or services, are moving in the same direction or at the same speed. Our sense is that the ISM Manufacturing Index will not stray too far in either direction from the 50.0 percent break between contraction or expansion over coming months. One thing the ISM’s May surveys had in common was that upward pressures on prices for non-labor inputs have yet to abate in either the manufacturing or services sectors, which is at odds with the premise of meaningful and sustained weakening in demand.
In last month’s edition, we noted that the April employment report was warmly embraced by market participants, as the appearance of softening labor market conditions inspired hope that the FOMC would be free to start cutting the Fed funds sooner rather than later. We noted that the operative word was “appearance,” as we argued the April employment report painted a misleadingly soft picture of labor market conditions. In contrast to many who instead saw the April report as a turning point, we expected payback in the May employment report, which proved to be the case. Total nonfarm employment rose by 272,000 jobs in May, trouncing the consensus forecast of an increase of 180,000 jobs, while average hourly earnings rose by 0.4 percent, leaving them up 4.1 percent year-on-year, up from April’s pace. Despite an increase in the unemployment rate, to 4.0 percent from 3.9 percent in April, the May employment report was given the cold shoulder by market participants, many of whom saw the robust job and wage growth a pushing the initial cut in the Fed funds rate further out into the future.
As was the case with the April employment report, our reaction to the May report was a bit different than that of market participants. As noted above, we expected payback in the May report, hence our forecast of an increase of 258,000 jobs. That said, just as we did not think the labor market had softened to nearly the degree implied by the April report, neither do we think the labor market to be as robust as implied by the May job and wage growth prints. Our view is that the seeming strength in the May data is a direct result of the seeming softness in the April data, with reality somewhere in between.
When viewed in concert, the past two employment reports are right in line with other indicators showing cooling labor market conditions. The trend rate of job growth is slowing, as is the trend rate of wage growth. We know from the Job Openings and Labor Turnover Survey (JOLTS) that job vacancies are falling rapidly and the rate at which firms are hiring workers has slipped below the pre-pandemic rate, as has the rate at which workers are voluntarily leaving jobs. Still, it is worth noting that the level of job vacancies remains well above pre-pandemic norms while the rate at which firms are laying off workers remains below pre-pandemic norms. In short, nothing has changed our assessment that, while cooling, the labor market is nowhere near on the verge of collapse.
Despite the considerable swings in the tone of the economic data over the past two months, our view of the underlying state of the U.S. economy is little changed, as can be seen in the comparison of our May and June baseline forecasts. The notable exception is the change in our take on Q2 real GDP growth, but that is mainly a reflection of the revised Q1 GDP data released between our forecast runs. We do think the economy is slowing, but we’ve expected that for some time, and we think inflation remains persistent enough to leave the FOMC on hold until at least September, if not longer. Sure, we get that markets are gonna do what markets are gonna do, and seeing considerable volatility in asset prices can lead one to feel they should be doing something, just as forecasters can be tempted to change their forecasts when so many others are doing the same. Sometimes, though, the best thing to do is nothing at all.

Sources: Bureau of Economic Analysis; Bureau of Labor Statistics; Institute for Supply Management
Investment Strategy Update
Stocks: A Historically Strong Seasonal Stretch Ahead
Regions Multi-Asset Solutions & Highland Associates
Historically, June has been a middle of the road month for the S&P 500 from a return perspective, with the index generating an average return of 0.7% dating back to 1928. However, during Presidential election years such as this, the S&P 500 has fared far better during June, with an average return of more than 7%. The June through August timeframe has been the second strongest consecutive three-month stretch in the calendar with an average return of 3% dating back to 1928, and in election years the S&P 500 return in the June-to-August window has averaged almost five times that figure. With June a historically strong month in election years, and with July’s average monthly return of 1.7% the highest average return of any calendar month since 1928, investors have often not been rewarded for selling in May and going away as the market adage would advise.
The S&P 500 could follow the typical election-year pattern and continue to rally this month, but catalysts capable of powering the index materially higher aren’t readily apparent. With earnings season in the rearview mirror, the FOMC standing pat on rates for a bit longer, and May’s favorable liquidity backdrop turning less supportive this month, a tempering of expectations is likely warranted over the near-term. Communication services and information technology have continued to lead the way as market leadership has narrowed and only around 50% of S&P 500 constituents were trading above their 50-day moving average as of this writing.
While upside may be limited in June, the necessary conditions don’t appear to be in place to generate a material drawdown in stocks either over the balance of the month and dips are likely to continue to be bought as investors try to position for a late summer rally. Positive earnings revisions continued to roll in during May, corporate credit spreads remain tight by historical standards, and the S&P 500 traded within a whisker of an all-time high at the time of this writing. Taken together, this tells us that momentum still resides firmly in the camp of market bulls, and with large cap stocks relative to small- and mid-cap (SMid) indices. We remain constructive on stocks, broadly speaking, and expect tailwinds to build into July/August as a positive seasonal backdrop and improved liquidity boost investor sentiment and risk appetite.
SMid Still Stuck Between a Rock and a Hard Place
Small- and mid-cap (SMid) stocks continued to lag the S&P 500 during May’s broad-market rally, and the S&P Small Cap 600 index trailed the 500 by 14% year-to-date as of early June. Small caps have been unable to get off the mat despite falling Treasury yields, a dynamic that should have provided a tailwind for the asset class. Continued tightness in the U.S. labor market, which has forced smaller companies to continue to pay up for labor, remains a near-term headwind. Profit margins and earnings growth are expected to be negatively impacted, which has weighed on sentiment surrounding the asset class. This combination has been a headwind for small cap stocks, and we don’t foresee this backdrop shifting in a more constructive direction over the near-term. Investors will likely continue to favor mega-cap technology stocks riding secular growth themes capable of weathering an economic downturn over smaller economically sensitive issues, at least until rate cuts out of the FOMC appear to be imminent.
Less Restrictive Monetary Policy a Positive for Euro Area Stocks, But Political Risk Is on The Rise, Leaving Us Neutral.
As expected, the European Central Bank (ECB) cut key policy rates by 25-basis points in early June but delivered a ‘hawkish cut’ as policymakers ratcheted inflation expectations higher for both 2025 and 2026 while pushing back on the prospect of additional rate cuts at upcoming meetings. The STOXX Europe 600 index tilts heavily toward cyclical sectors such as financial services, industrials, and materials, and maintains a healthy allocation to interest rate-sensitive sectors such as utilities and telecommunications. In isolation, lower short-term interest rates could boost economic activity, corporate profits, and investor sentiment for euro area equities. However, the ECB’s ability to cut rates further over the coming months will depend upon how quickly inflationary pressures subside in the euro area and actions – or inaction – out of central banks in the U.S. and Asia. Monetary policy in the euro area is trending in the right direction, but political dysfunction across the currency bloc is on the rise as elections held in early June were destabilizing and heightened political risk/uncertainty put upward pressure on sovereign bond yields. As countries across the euro area prepare for snap elections in the coming months, economic activity could slow to a crawl despite lower interest rates. A wait-and-see approach to euro area equities is warranted until the political storm clouds begin to clear.
Election Results Spark Volatility in Emerging Markets.
After a promising start to May, emerging market stocks reversed course mid-month as macro forces weakened developing market currencies relative to the U.S. dollar. Thus far, June has brought with it a trend reversal as U.S. Treasury yields have fallen, but political risk has crept in with influential elections in Mexico, India, and South Africa taking place over recent weeks. The common thread between reactions to these elections was a pronounced jump in volatility, regardless of whether there was a surprise or expected outcome. Changes in government can certainly impact the business environment, but markets have historically tended to overreact to election results – both on the upside and downside – as candidates are often more extreme on the campaign trail than they are when they take office. Political uncertainty is often elevated in emerging markets and is another reason diversification is crucial when allocating to higher-risk/ higher-reward asset classes.
Bonds: Rate Risks Coming into Balance
While interest rate volatility is likely to persist as market participants overreact to incoming economic data, upside and downside risks for yields could move more into balance in the coming months, leading to some relative stability in the bond market. Inflation remains sticky and progress on bringing inflation down to the FOMC’s two percent target is likely to remain painfully slow, but we continue to expect price pressures to ease over the balance of 2024 and 2025, putting modest downward pressure on long-term Treasury yields in the process. The size of upcoming Treasury auctions amidst a buyer’s strike from abroad (China, Japan) has created angst on the part of investors and has played a role in driving investors into shorter duration bonds. Treasury secretary Janet Yellen has taken notice of this preference for short-term paper and has responded by issuing larger amounts of bills and notes as opposed to longer dated bonds, which has helped keep a lid on yields farther out on the Treasury curve. The U.S. Treasury shifting issuance to the short end of the curve, along with the FOMC allowing $25B per month of Treasuries (down from the planned $60B) to run off its balance sheet starting in July, should prevent yields from running away to the upside.
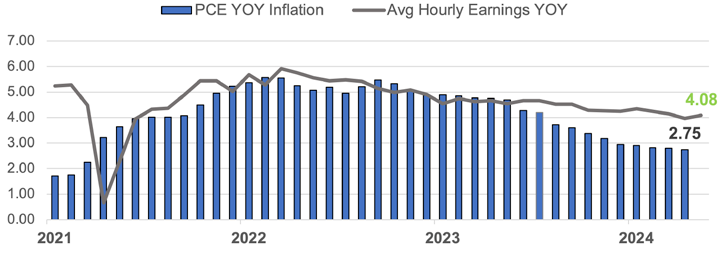
Conversely, we see few reasons for Treasury yields to fall materially over the near-term. The U.S. economy is still on a path to approximately 2% growth this year and inflationary pressures will likely ease only gradually over the coming quarters. The labor market remains strong and average hourly earnings have risen 3.9% or more year over year in every month this year. A resilient U.S. economy and labor market strength, combined with political risk in the euro area keeping upward pressure on sovereign yields abroad should put a floor under U.S. Treasury yields not too far from current levels. Investors will want to be appropriately compensated for taking on the risk that inflation and/or economic growth reaccelerates in the coming months. We see Treasuries as fairly valued at present, with long-term bonds tilting more toward ‘rich’ than ‘cheap’ after the drop in yields at the start of June. As a result of this view, we prefer a duration profile in-line with that of the Bloomberg Aggregate Bond index as a ‘coupon clipping’ backdrop remains in place.
Difficult To See Much Downside For Yields With Wage Growth Running Well Above Inflation
Source: Bloomberg
Few Signs of Stress in High Yield, But Credit Spreads Unlikely to Tighten Much from Here
Riskier corporate bonds have had a relatively strong start to the year, with the Bloomberg U.S. Corporate High Yield index turning out a respectable 1.6% gain through May, outpacing the Bloomberg Aggregate (Agg) Bond index’s 1.6% decline and the Bloomberg Corporate Bond index’s 1.1% drop. The Corporate High Yield index’s strong relative performance has been due to the shorter duration profile of the index which makes it less sensitive to rising interest rate than are the Treasury-heavy Agg and the investment- grade only Bloomberg Corporate index. Higher yielding corporate bonds have been boosted by strong investor risk appetite and by expectations that the U.S. economy will remain resilient, a combination serving to modestly tighten credit spreads throughout the first five months of this year. Yields on riskier corporate bonds did move higher in early June as fears of a U.S. economic slowdown forced Treasury yields lower and investors required greater compensation for taking credit risk. But credit spreads remain tight by historical standards and are far from levels that might indicate stress or fear on the part of investors. Investors should temper expectations as credit spreads are unlikely to tighten in much from here, setting up a scenario in which holders receive their coupon but little else from exposure to the asset class.
Emerging Market Debt Still a Strong Contender for Capital
Debt issued by emerging economies was among the top performing fixed income asset classes in May. The J.P. Morgan Emerging Market Bond index (EMB) generated a 2.6% total return as a higher yield and longer duration profile were rewarded. May’s rally took the trailing 12-month total return on the EMBI to a more than respectable 10.4%. Such a strong advance during a period in which the Bloomberg Aggregate Bond index generated just a 1.3% total return, has prompted valuation concerns. When viewed through the lens of option- adjusted spreads (OAS) relative to U.S. Treasuries, upside in emerging debt appears limited with a current yield just 253-basis points above the yield on U.S. government securities with a similar duration. This is below the 20-year average of 329-basis points. Historically, a tight spread such as this has often signaled that yields on emerging market debt are no longer high enough to compensate investors for credit, interest rate, and political risk, among others, but that isn’t necessarily the case this time around.
Yields on emerging market debt are still over 7%, or 100-basis points above the 20-year average. So, the reason the OAS has narrowed is that Treasury yields have risen, not because yields on EM debt is well below historical levels. Put simply, higher treasury yields due to sticky and elevated U.S. inflation may mean EM debt is cheaper than it appears. One way to gauge this is by comparing the historical excess yield between the broader developed sovereign debt market relative to emerging debt yields. As of the end of May, EM debt held a 4.2% yield advantage relative to the developed sovereign benchmark, right in line with its 10-year average.
EMD No Longer Cheap, But Still Relatively Attractive

Source: Bloomberg
That’s far from extreme overvaluation when one considers the stronger fiscal discipline required on the part of emerging countries to float debt and fundamental improvements sweeping across the emerging markets landscape which leave current yields within an acceptable range. One potential concern stemming from this assessment is that tight spreads in risk assets can lead to price declines as investors demand more yield, but spreads can also widen if Treasury yields decline and emerging market yields mark time and move sideways. Alongside potential upside catalysts including a stronger U.S. dollar and lower U.S. rates, lead us to maintain a constructive stance on EM debt, even if we aren’t looking to increase exposure at current yields/spreads.
IMPORTANT DISCLOSURES: This publication has been prepared by the staff of Highland Associates, Inc. for distribution to, among others, Highland Associates, Inc. clients. Highland Associates is registered with the United States Security and Exchange Commission under the Investment Advisors Act of 1940. Highland Associates is a wholly owned subsidiary of Regions Bank, which in turn is a wholly owned subsidiary of Regions Financial Corporation. Research services are provided through Multi-Asset Solutions, a department of the Regions Asset Management business group within Regions Bank. The information and material contained herein is provided solely for general information purposes only. To the extent these materials reference Regions Bank data, such materials are not intended to be reflective or indicative of, and should not be relied upon as, the results of operations, financial conditions or performance of Regions Bank. Unless otherwise specifically stated, any views, opinions, analyses, estimates and strategies, as the case may be (“views”), expressed in this content are those of the respective authors and speakers named in those pieces and may differ from those of Regions Bank and/or other Regions Bank employees and affiliates. Views and estimates constitute our judgment as of the date of these materials, are often based on current market conditions, and are subject to change without notice. Any examples used are generic, hypothetical and for illustration purposes only. Any prices/quotes/statistics included have been obtained from sources believed to be reliable, but Highland Associates, Inc. does not warrant their completeness or accuracy. This information in no way constitutes research and should not be treated as such. The views expressed herein should not be construed as individual investment advice for any particular person or entity and are not intended as recommendations of particular securities, financial instruments, strategies or banking services for a particular person or entity. The names and marks of other companies or their services or products may be the trademarks of their owners and are used only to identify such companies or their services or products and not to indicate endorsement, sponsorship, or ownership by Regions or Highland Associates. Employees of Highland Associates, Inc., may have positions in securities or their derivatives that may be mentioned in this report. Additionally, Highland’s clients and companies affiliated with Highland Associates may hold positions in the mentioned companies in their portfolios or strategies. This material does not constitute an offer or an invitation by or on behalf of Highland Associates to any person or entity to buy or sell any security or financial instrument or engage in any banking service. Nothing in these materials constitutes investment, legal, accounting or tax advice. Non-deposit products including investments, securities, mutual funds, insurance products, crypto assets and annuities: Are Not FDIC-Insured I Are Not a Deposit I May Go Down in Value I Are Not Bank Guaranteed I Are Not Insured by Any Federal Government Agency I Are Not a Condition of Any Banking Activity.
Neither Regions Bank nor Regions Asset Management (collectively, “Regions”) are registered municipal advisors nor provide advice to municipal entities or obligated persons with respect to municipal financial products or the issuance of municipal securities (including regarding the structure, timing, terms and similar matters concerning municipal financial products or municipal securities issuances) or engage in the solicitation of municipal entities or obligated persons for such services. With respect to this presentation and any other information, materials or communications provided by Regions, (a) Regions is not recommending an action to any municipal entity or obligated person, (b) Regions is not acting as an advisor to any municipal entity or obligated person and does not owe a fiduciary duty pursuant to Section 15B of the Securities Exchange Act of 1934 to any municipal entity or obligated person with respect to such presentation, information, materials or communications, (c) Regions is acting for its own interests, and (d) you should discuss this presentation and any such other information, materials or communications with any and all internal and external advisors and experts that you deem appropriate before acting on this presentation or any such other information, materials or communications.
Source: Bloomberg Index Services Limited. BLOOMBERG® is a trademark and service mark of Bloomberg Finance L.P. and its affiliates (collectively “Bloomberg”). BARCLAYS® is a trademark and service mark of Barclays Bank Plc (collectively with its affiliates, “Barclays”), used under license. Bloomberg or Bloomberg’s licensors, including Barclays, own all proprietary rights in the Bloomberg Barclays Indices. Neither Bloomberg nor Barclays approves or endorses this material or guarantees the accuracy or completeness of any information herein, or makes any warranty, express or implied, as to the results to be obtained therefrom and, to the maximum extent allowed by law, neither shall have any liability or responsibility for injury or damages arising in connection therewith.