
Download Asset Allocation | January 2024
Turn the Page
Economic Update
Even More Stuff May or May Not Happen in 2024
By Regions Economic Division
Our 2024 outlook is a natural follow-up to our 2023 outlook, which, as some readers will recall, was “Lots of Stuff May or May not Happen in 2023.” At the risk of appearing immodest, our 2023 outlook wasn’t just correct, it was spot-on, dead-bang, on-the-money correct, as lots of stuff did indeed happen in 2023 and lots of stuff indeed didn’t happen in 2023. Moreover, some of the stuff that happened in 2023 was stuff we thought would happen, and some of the stuff that didn’t happen in 2023 was stuff we didn’t think would happen. OK, fine, for those who want to quibble, some stuff we thought would happen in 2023 didn’t, and some stuff we didn’t think would happen in 2023 did, which, at least in that sense, made 2023 just like any other year.
One thing that did not happen in 2023, and that we did not expect to happen, was the U.S. economy slipping into recession. That we did not have recession as our base case kept us at odds with many of our counterparts. After all, many forecasters were quick to make recession their base case as soon as the Federal Open Market Committee (FOMC) began raising the Fed funds rate back in 2022, and rather than abandoning those calls as the economy stayed afloat, most of these forecasters simply pushed back the start of recession in their forecasts, which some are still doing in early 2024. While we have not at any point in the current cycle had recession as our base case, one thing we clearly got wrong in our 2023 outlook was how well the economy would hold up under the weights of elevated inflation and higher interest rates. When the Q4 GDP data are released on January 25, we expect they will show full-year 2023 real GDP growth of 2.4%, easily beating our well above consensus forecast of 1.1%.
Consumer spending, business spending on structures, and government spending grew at faster rates than we anticipated, while residential fixed investment, business investment in equipment/machinery, and net exports stuck to the script. One key to the economy outperforming our forecast in 2023 was the labor market holding up better than we expected. Job growth slowed much less than we anticipated while labor force participation rose slightly more than we anticipated, reflecting both higher participation among the prime-age (i.e., 25 to 54 years old) cohort and increased immigration. Moreover, labor productivity growth was stronger than we expected, which, in turn, helped fuel faster real GDP growth. Between normalizing global supply chain and logistics networks, higher labor force participation, and faster productivity growth, 2023 was a very good year for the supply side of the U.S. economy, perhaps the most underappreciated storyline of the economy in 2023. Our baseline forecast anticipates real GDP growth of 2.1% in 2024.
Despite consumer confidence languishing at levels that in the past have been associated with recession, 2023 growth in consumer spending handily beat our forecast. Solid growth in inflation-adjusted labor earnings, still-strong household balance sheets, and solid growth in spending on discretionary services were more than enough to offset consumers’ dour moods. That said, growth in spending did ease in late-2023, and we expect this more sedate pace of growth to prevail over the first half of 2024 before picking up over the second half of the year. We do expect a slowing pace of job growth to put modest upward pressure on the unemployment rate, but nonetheless expect growth in aggregate labor earnings to continue to outpace inflation, thus acting as a support for consumer spending.
Real business investment in equipment and machinery fell in Q3 2023, the third contraction in four quarters, and while the Q4 data may bring some respite, we expect this softness to linger over 1H 2024. At the same time, the wave of business spending on structures seen over much of 2023 is subsiding, to the point that we expect real spending on structures to offer little, if any, support for real GDP growth in 2024. We do expect business investment in intellectual property products to return to its usual role as the fastest growing segment of real business fixed investment after having been displaced by spending on structures in 2023.
Higher mortgage interest rates weighed on single-family construction and sales in 2023, but sales of new single-family homes proved to be more resilient than our forecast anticipated. That largely reflected the combination of still-significant pent-up demand for home purchases and the paucity of existing single-family homes for sale, with higher mortgage rates effectively locking many homeowners in place. Builders were aggressive in the use of incentives, including mortgage rate buydowns, to help pare down larger than desired inventories of spec homes. With mortgage rates having turned lower, helping to ease affordability constraints but likely not doing much to unlock inventories of existing homes for sale, builders should fare better this year and, after what will likely be a double-digit decline for full-year 2023, real residential fixed investment should be a modest support for top-line real GDP growth in 2024.
Our 2023 outlook had inflation slowing but ending the year above the FOMC’s 2.0% target rate, which proved to be the case. Our 2024 outlook anticipates further deceleration in inflation, with both headline and core inflation at 2.1% in Q4 2024 as measured by the PCE Deflator. Even with inflation remaining above their target rate, however, there is still room for the FOMC to begin cutting the Fed funds rate if inflation continues to decelerate. This can be best understood in the context of the real, or inflation-adjusted, Fed funds rate, which is generally seen as a useful guide to the stance of monetary policy. At present, the real funds rate is higher than at any point since prior to the Great Financial Crisis, but of even more relevance is that the FOMC’s estimates of the “neutral” nominal funds rate and the long-term trend rate of inflation put their estimate of the neutral real funds rate at 0.5%. While we don’t think most FOMC members see it as being that low, the broader point is that the current value of the real funds rate is well above the neutral rate.
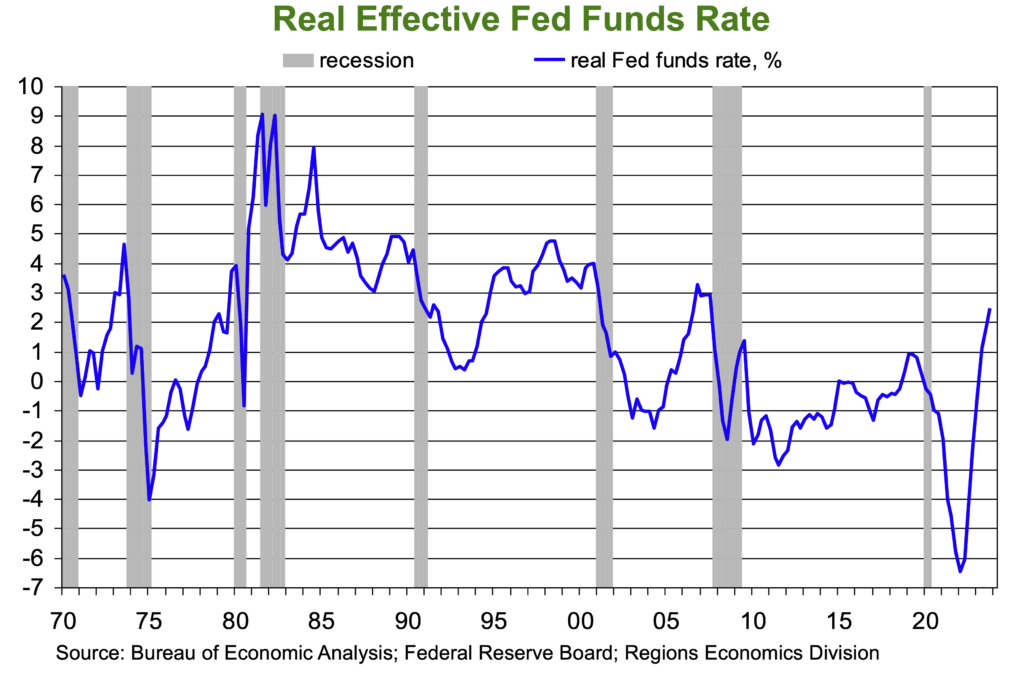
Should inflation continue to decelerate, that would push the real funds rate higher, effectively making policy more restrictive even absent any further hikes in the nominal funds rate. But, if we are correct in anticipating a slower pace of economic growth, a modestly rising unemployment rate, and inflation decelerating further in 2024, that would be consistent with the FOMC beginning to cut the Fed funds rate even with inflation above their 2.0% target rate. We expect four 25-basis-point cuts in the funds rate by year-end 2024. Though the March FOMC meeting may prove to be too early for rate cuts, we’d put that start no later than the May FOMC meeting.
One thing we clearly got right in our 2023 outlook was saying that at the end of 2023 the economy was unlikely to look as we, at the start of the year, expected it to, though we did not at the time know why that would be the case. With that call having worked so well for us in our 2023 outlook, it seems appropriate to let it ride in our 2024 outlook.
Sources: U.S. Bureau of Economic Analysis; U.S. Bureau of Labor Statistics; University of Michigan Surveys of Consumers
Investment Strategy Update
Stocks: Potentially a Tale of Two Halves for Large Caps in ’24
Regions Multi-Asset Solutions & Highland Associates
Large-cap domestic stocks (S&P 500) turned out an impressive 26.2% total return in 2023, the third time in the last five years that the index generated a 20% or greater gain. Going back to 1950, not counting 2023, there have been 19 instances of the S&P 500 turning out a 20%+ calendar year return. The following year was positive 15 of the 19 times, for an average return of 9.8%, and if one chooses to data mine and exclude the years in which the index finished lower, that average return jumps to 17.3%. While past performance is not representative of future results, it can be a valuable guidepost. It’s completely rational to consider taking profits while you have them and getting more defensively positioned following years in which stocks generate sizable gains, but history tells us that “strategy” has rarely been rewarded and argues for staying the course, rebalancing, and tweaking around the edges while avoiding wholesale portfolio shifts in the coming year.
The S&P 500 enters the new year trading at 19.6 times projected next 12 months earnings, above the 30-year average of 18.3. But valuation in isolation tells us very little, and we try to meld valuations with fundamentals and sentiment to inform our decision-making. Downward revisions to 2024 S&P 500 earnings estimates flooded in during 4Q23, highlighting increased uncertainty surrounding the fundamental underpinnings of the S&P 500 (i.e., profitability) in the coming year. It’s notable that the current 2024 earnings estimate still implies lofty 11.7% year over year earnings growth. Productivity gains and cost cutting could drive mid-to-high single-digit earnings growth for the S&P 500 in the coming year, but with U.S. economic growth expected to moderate, 11.7% will likely prove too aggressive and the downward bias to estimates should persist, tamping down investor sentiment over the near-term.
Historically, in the fourth year of a Presidential term in which the incumbent ran for reelection, the S&P 500 has struggled in the first quarter before finding its footing in the back half of the year to close the year higher. With the S&P 500 entering 2024 near overbought territory and with positioning surveys pointing toward investors all-in on stocks, the S&P 500 may need to digest 2023’s sizable gains before the uptrend resumes. While we expect the S&P 500 to fare well in the coming year, other equity sub-asset classes that have underperformed of late could be poised to play catch-up.
Constructive on Small- and Mid-Cap (SMid) as Headwinds Abate, M&A Activity Picks Up
The S&P 1000, which combines the S&P Small-Cap 600 and the S&P Mid-Cap 400, turned out a 14.3% price return in 2023, with the entirety of that performance coming in just the last seven weeks of the year. The S&P 1000 lagged the S&P 500 by a significant margin through mid-November before catching a bid into year-end as Treasury yields dropped with market participants buying into the idea that continued deceleration in inflation would allow the FOMC to cut the Fed funds rate by 150 basis points during 2024. Falling Treasury yields and easing financial conditions would lower funding costs for heavily indebted small and mid-sized companies, while also providing a potentially powerful tailwind for mergers and acquisitions (M&A) activity to pick up. Small-cap valuations are also appealing, with the S&P 600 trading at 17.2 times projected 2024 earnings, below the 15-year average of 21 times. This valuation is evidence of a high level of healthy investor skepticism surrounding the asset class. While we are constructive on SMid after a sharp rally to close out 2023, we would expect some digestion and/or give-back early in the new year, which would likely present a better opportunity to increase exposure.

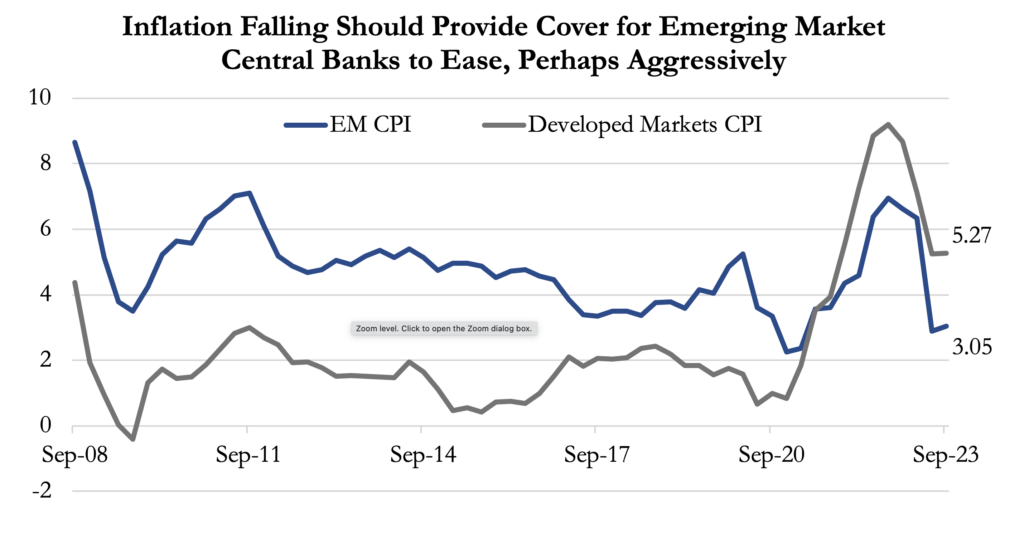
Emerging Markets a Beneficiary of Central Banks in Easing Mode
Emerging market central banks, broadly speaking, were some of the first and most aggressive to tighten policy as inflation surged, and they could be some of the most aggressive in cutting rates over the coming year(s). This about-face should spur capital inflows and economic growth. As a result, we expect emerging market stocks to fare relatively well in the coming year. China remains top-of-mind on the list of concerns for investors in emerging markets, but with expectations and sentiment surrounding China’s economy and Chinese stocks plumbing rock-bottom levels, even modest signs of economic improvement or the Chinese government stepping up efforts to improve consumer confidence could provide a sizable tailwind for the MSCI Emerging Markets index.
Bonds: An About-Face for Yields Early in the New Year?
Interest rate volatility is likely to persist in the new year, and after the sharp move lower in yields to close out 2023, we see risks skewed to the upside for Treasury yields and to the downside for bond prices over the near-term. Inflation continued to ease into year-end, but progress could be painfully slow from here, particularly if energy prices rebound into the spring/summer driving season. The labor market has softened in recent months but remains tight, evidenced by the 3.7% unemployment rate. Inflation continuing to run ahead of the FOMC’s 2.0% target rate and continued labor market tightness call into question the market’s expectation for 150 basis points of rate cuts in the coming year, and the push/pull between the FOMC and market participants should generate continued interest rate volatility.
The U.S. Treasury’s quarterly refunding announcement in early November was cheered by investors. The bulk of the issuance was shifted to shorter maturity bills, which market participants took as evidence that Treasury was aware of potential lackluster demand farther out on the yield curve and made an active decision to issue shorter-term debt. However, with the yield on the 10-year U.S. Treasury hovering around 4% in early January, substantially below late October levels, we expect the U.S. Treasury to extend the duration of its borrowings and issue a larger percentage of debt farther out on the curve, potentially starting in the second quarter of 2024, which could keep some upward pressure on yields. Higher-quality investment-grade bonds should remain a core holding for investors seeking income and capital preservation above all else out of their fixed income portfolio.
Continuing to Look Beyond ‘Core’ in ’24
As 2023 kicked off, we were constructive on bonds, broadly speaking, as core investment-grade, high-yield, and emerging market bond indices were all coming off a year of double-digit declines in 2022, and we believed higher yields were again providing ample compensation for investors willing to accept interest rate and/or credit risk. While most fixed income indices turned out gains last year, it is telling that higher yielding, lower quality and/or less interest rate sensitive bonds held up better than more rate-sensitive higher quality bonds leading up to a peak in Treasury yields in late October. The coming year could rhyme with 2023 from a rates perspective, and as a result we believe investors will likely again be rewarded for looking beyond core investment-grade bonds.
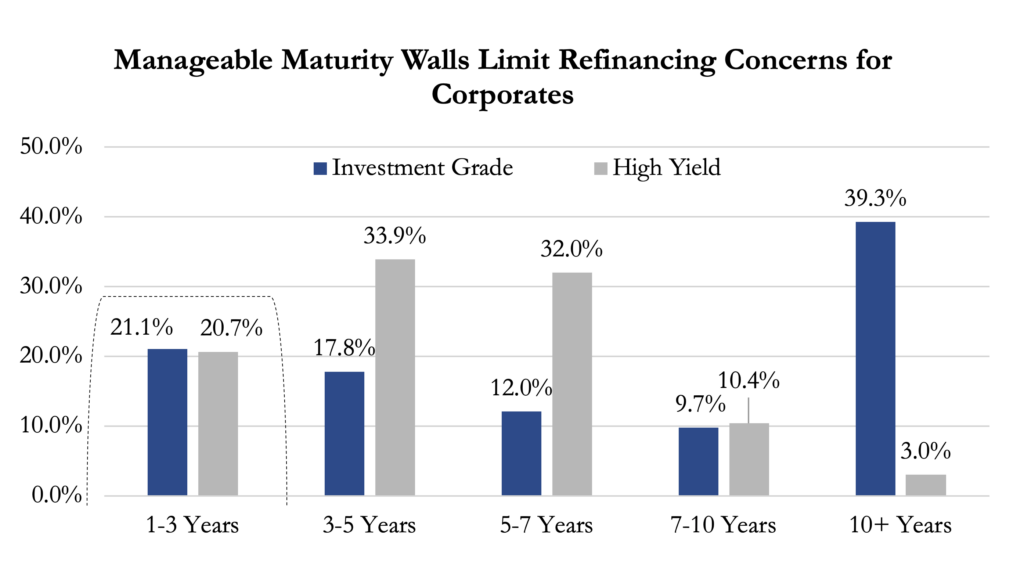
Our outlook calls for U.S. Treasury yields to remain volatile with an upward bias to rates in the belly and long end of the curve. This backdrop should favor riskier, higher-yielding corporate bonds with less interest rate sensitivity yet again, although we would temper expectations after last year’s outsized gains. High-yield corporate bonds are our preferred non-core exposure in the coming year, with an 8% yield-to-worst (YTW) on the Bloomberg U.S. Corporate High Yield index and only modest refinancing concerns as less than 8% of the index is set to mature in the next 24 months. We believe investors are being well compensated for credit risk given the economic backdrop we expect to materialize in the coming year.
Highland Associates Cross Asset Views
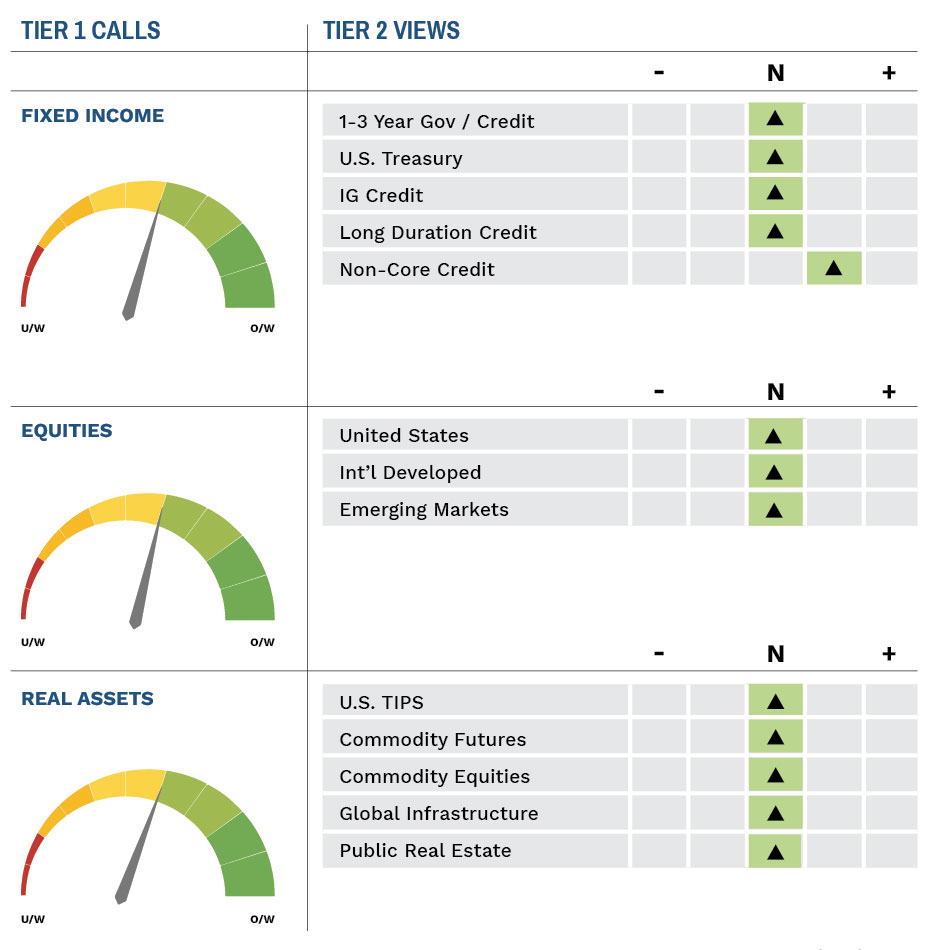
As of 01/17/2024
IMPORTANT DISCLOSURES: This publication has been prepared by the staff of Highland Associates, Inc. for distribution to, among others, Highland Associates, Inc. clients. Highland Associates is registered with the United States Security and Exchange Commission under the Investment Advisors Act of 1940. Highland Associates is a wholly owned subsidiary of Regions Bank, which in turn is a wholly owned subsidiary of Regions Financial Corporation. Research services are provided through Multi-Asset Solutions, a department of the Regions Asset Management business group within Regions Bank. The information and material contained herein is provided solely for general information purposes only. To the extent these materials reference Regions Bank data, such materials are not intended to be reflective or indicative of, and should not be relied upon as, the results of operations, financial conditions or performance of Regions Bank. Unless otherwise specifically stated, any views, opinions, analyses, estimates and strategies, as the case may be (“views”), expressed in this content are those of the respective authors and speakers named in those pieces and may differ from those of Regions Bank and/or other Regions Bank employees and affiliates. Views and estimates constitute our judgment as of the date of these materials, are often based on current market conditions, and are subject to change without notice. Any examples used are generic, hypothetical and for illustration purposes only. Any prices/quotes/statistics included have been obtained from sources believed to be reliable, but Highland Associates, Inc. does not warrant their completeness or accuracy. This information in no way constitutes research and should not be treated as such. The views expressed herein should not be construed as individual investment advice for any particular person or entity and are not intended as recommendations of particular securities, financial instruments, strategies or banking services for a particular person or entity. The names and marks of other companies or their services or products may be the trademarks of their owners and are used only to identify such companies or their services or products and not to indicate endorsement, sponsorship, or ownership by Regions or Highland Associates. Employees of Highland Associates, Inc., may have positions in securities or their derivatives that may be mentioned in this report. Additionally, Highland’s clients and companies affiliated with Highland Associates may hold positions in the mentioned companies in their portfolios or strategies. This material does not constitute an offer or an invitation by or on behalf of Highland Associates to any person or entity to buy or sell any security or financial instrument or engage in any banking service. Nothing in these materials constitutes investment, legal, accounting or tax advice. Non-deposit products including investments, securities, mutual funds, insurance products, crypto assets and annuities: Are Not FDIC-Insured I Are Not a Deposit I May Go Down in Value I Are Not Bank Guaranteed I Are Not Insured by Any Federal Government Agency I Are Not a Condition of Any Banking Activity.
Neither Regions Bank nor Regions Asset Management (collectively, “Regions”) are registered municipal advisors nor provide advice to municipal entities or obligated persons with respect to municipal financial products or the issuance of municipal securities (including regarding the structure, timing, terms and similar matters concerning municipal financial products or municipal securities issuances) or engage in the solicitation of municipal entities or obligated persons for such services. With respect to this presentation and any other information, materials or communications provided by Regions, (a) Regions is not recommending an action to any municipal entity or obligated person, (b) Regions is not acting as an advisor to any municipal entity or obligated person and does not owe a fiduciary duty pursuant to Section 15B of the Securities Exchange Act of 1934 to any municipal entity or obligated person with respect to such presentation, information, materials or communications, (c) Regions is acting for its own interests, and (d) you should discuss this presentation and any such other information, materials or communications with any and all internal and external advisors and experts that you deem appropriate before acting on this presentation or any such other information, materials or communications.
Source: Bloomberg Index Services Limited. BLOOMBERG® is a trademark and service mark of Bloomberg Finance L.P. and its affiliates (collectively “Bloomberg”). BARCLAYS® is a trademark and service mark of Barclays Bank Plc (collectively with its affiliates, “Barclays”), used under license. Bloomberg or Bloomberg’s licensors, including Barclays, own all proprietary rights in the Bloomberg Barclays Indices. Neither Bloomberg nor Barclays approves or endorses this material or guarantees the accuracy or completeness of any information herein, or makes any warranty, express or implied, as to the results to be obtained therefrom and, to the maximum extent allowed by law, neither shall have any liability or responsibility for injury or damages arising in connection therewith.