
Download Asset Allocation | October 2023
Can You Take Me (Yields) Higher
Economic Update
What Goes Up Must Come Down
… At Least Part of the Way
By Regions Economic Division
In our preview of the September Federal Open Market Committee (FOMC) meeting in last month’s edition of this commentary, we said the following: “. . . while a funds rate hike may not be in the offing at this month’s meeting, the committee could use their updated economic and financial projections, including an updated “dot plot,” to send a hawkish message that would rattle the markets.” Whether or not that was their intent, the FOMC seems to have done just that. While the FOMC left the Fed funds rate unchanged, the updated dot plot implied two fewer 25 basis point cuts in the funds rate in 2024 than had been implied in the June edition. While some, us included, were expecting one rate cut to be taken out, many expected the same 100 basis points of cuts, so, it seems clear that the FOMC indeed sent a hawkish message, and it is just as clear that markets were rattled.
Upon the mid-afternoon release of the FOMC’s policy statement and financial projections on September 20, equity and bond prices dropped sharply, the latter of which sent longer-term yields shooting higher, particularly yields on U.S. Treasury securities with maturities of five years or longer. While such a reaction to an unpleasant surprise may seem perfectly reasonable, there are two
things that stand out. In the case of longer-term yields, that initial jump in yields was not a one-off adjustment to the change in the implied path of the Fed funds rate, as yields have continued to push higher.
What also stands out is that, while the long end of the Treasury yield curve is up sharply since the September FOMC meeting, the short end of the curve has barely budged. Most notably, yields on two-year Treasury notes, considered an indicator of the expected path of monetary policy, are actually a few basis points lower than they were prior to the FOMC meeting. While the markets seem to be discounting the additional 25 basis point hike in the funds rate implied by the most recent dot plot – a hike also implied in the June edition – they also seem to be buying into the “higher for longer” message that the FOMC has been trying to hammer home for some time now. At present, yields on two-year Treasury notes are pricing in little, if any, change in the FOMC’s policy stance over coming quarters. Moreover, while the 2-year/10-year portion of the Treasury yield curve is still inverted, as it has been since July 6, 2022, the (negative) spread between the two is narrower than at any time since last October 24. As it is well known that an inverted yield curve has typically been a harbinger of recession, it may be tempting to interpret the narrowing inversion as good news. We would remind you, however, that recessions following inverted yield curves have tended to begin once the curve has retaken an upward slope.
Take that as more of a friendly, even if a bit ominous, reminder rather than us making a recession call – we have not at any point in this cycle had recession as our base case, and we still don’t. Any such calls would be out of line with a recent spate of seemingly solid data points. For instance, total nonfarm payrolls rose by 338,000 jobs in September, blowing past expectations, while prior estimates of job growth in July and August were revised up by a net 119,000 jobs for the two-month period. The Institute for Supply Management’s (ISM) Non- Manufacturing Index for September showed continued expansion in the broad services sector, and while the ISM Manufacturing Index signaled an 11th straight month of contraction in the factory sector, the headline index
rose to 49.0%, the highest reading since last November. Powered by surprisingly strong growth in consumer spending, a narrower trade deficit, and a larger build in business inventories, real GDP was on course to grow at an annualized rate of around 4.0% for Q3.
In the August edition of this commentary, we discussed the widening embrace of the “soft landing” narrative, in which the economy continues to grow, and inflation continues to slow. The recent spate of data, however, suggest something stronger than a soft landing, and this has likely helped push longer-term interest rates higher. Another factor many are pointing to is growing concern about the scope of borrowing by the U.S. Treasury that will be needed to finance growing budget deficits. At the same time, the surge in crude oil prices and accompanying increase in retail gasoline prices seen during September raised fears that inflation may reaccelerate, perhaps not to a degree sufficient to trigger further Fed funds rate hikes but enough to keep the FOMC on hold for longer. Some have also pointed to the surge in demand for Japanese government bonds triggered by the Bank of Japan modestly relaxing its “yield curve control” policy in July as a warning about the U.S.’s reliance on foreign capital to finance its federal government budget deficits.
While plausible, none of those explanations seems satisfactory to account for the upward march of long-term interest rates. The prospect of widening budget deficits is certainly nothing new, so it seems unlikely to account for the recent run-up in long-term rates. And, while crude oil prices have fallen significantly over the past few weeks (as of this writing), raising the prospect of a more rapid deceleration in inflation, long-term rates have not fallen in concert. Moreover, we can pick holes in much of the recent economic data, as the details of many of the recent data releases are not nearly as solid as implied by the headline numbers, particularly in the case of the labor market data. At the same time, the latest jump in mortgage interest rates has in short order taken a toll on homebuilder confidence and applications for purchase mortgage loans, and higher rates will take a toll in other interest-sensitive segments of the economy. As such, we continue to expect real GDP to basically flatline in Q4.
If we are correct in our view, longer-term rates should begin to back down. The question, however, is how low they would go. The prospect that inflation may not settle all the way back to the FOMC’s 2.0% target rate, the prospect of further removal of monetary accommodation by the Bank of Japan, and, while not new, the prospect of greater U.S. Treasury borrowing needs could combine to put a floor under longer-term rates. So, while not all of the recent run-up may stick, rates figure to remain in higher ranges than markets have become accustomed to over the past decade and a half.
Selected Interest Rates, % Weekly Data
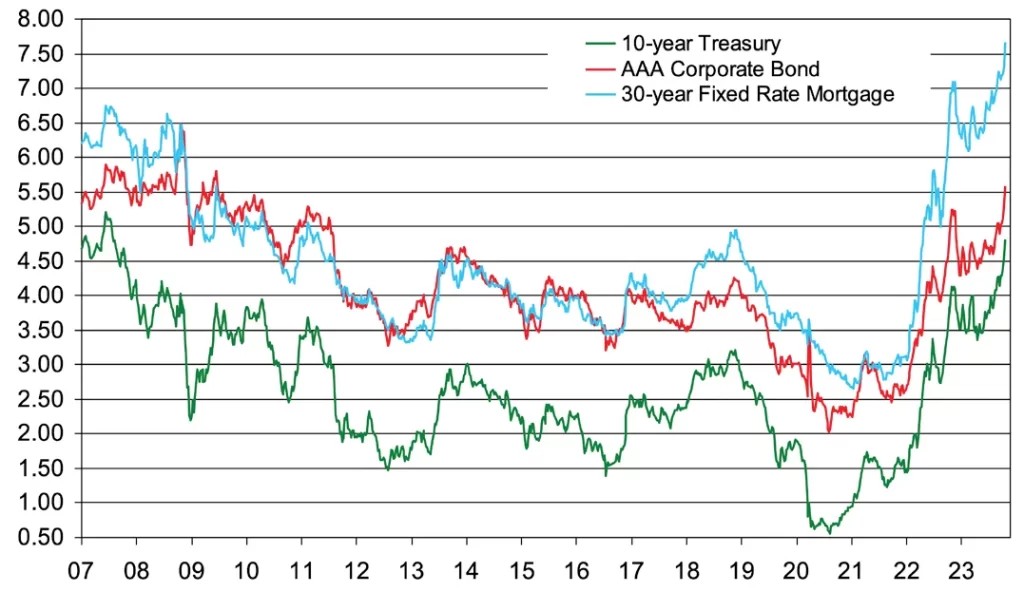
Sources: U.S. Bureau of Economic Analysis; U.S. Bureau of Labor Statistics; Federal Reserve Board of Governors; Institute for Supply Management
Investment Strategy Update
August and September lived up to their historical billing as challenging months for stocks, evidenced by the S&P 500 falling 6.3% during the past two-month stretch. Looking ahead, October has garnered a reputation for producing extreme outcomes, primarily due to market crashes occuring during the month in 1907, 1929, and 1987. Given the current backdrop headlined by a rapid rise in interest rates and concerns over U.S. economic growth, investors will likely remain on edge. Quarterly earnings season ramps up mid-month, and despite what is expected to be strong 3Q GDP growth, S&P 500 sales are expected to grow just 1.8% year over year and earnings an even more paltry 0.6%. If trailing results prove as lackluster as the consensus
projects, fragile investor sentiment and minimal appetite for risk could limit upside for stocks in October.
September was most unkind to stocks of smaller companies, with the Russell 2000 Index falling 6% during the month. The gap – or, at this point, canyon – that has developed between valuations of large-cap and small-cap stocks is representative of investor concerns surrounding higher refinancing costs, as well as lowered free cash flow and profitability for small-cap names driven by the rapid rise in interest rates. Many valuation metrics for small-cap stocks are sitting at/near multi-decade lows. The macro environment often weighs more heavily on forward return expectations for the Russell 2000 as the index tilts toward cyclical sectors that fare best on a relative basis in the early innings of an economic upswing.
Outside the U.S., The U.S. Dollar Index, or DXY, hit a year-to- date high of 107.35 in early October for a not-insignificant 3.4% year-to-date gain. While a strong U.S. dollar will likely be a modest headwind for S&P 500 earnings, it poses a bigger threat to international developed and emerging market stocks as it is often a by-product of capital flight into U.S. dollar denominated assets. Foreign investors seek out relative safety in the dollar during times of heightened uncertainty such as now. Moreover, investors borrowing in relatively lower yielding foreign currencies also have a potential total return “kicker” from U.S. dollar strength as an additional reason to pour capital into the U.S. As a result, the U.K., eurozone, and commodity-importing emerging economies face negative impacts from a stronger U.S. dollar, and equities domiciled in those areas could remain under pressure until the uptrend in the U.S. dollar stalls or reverses course. Furthermore, the economic malaise plaguing Europe could get worse as a colder winter could bring about higher energy prices and lead to inflationary pressures reaccelerating into year-end. With Treasury yields higher and the FOMC still in play, we see these dynamics as supportive of the dollar. Against this backdrop, we continue to hold a Neutral risk position in portfolios and remain focused on adding yield and identifying relative value opportunities across fixed income, equity, and alternative markets.
Fixed Income Update
Higher for Longer Starting to Sink In
Regions Multi-Asset Solutions, Highland Associates
The yield on the 10-year U.S. Treasury note rose 78 basis points (bps) during the third quarter and 50 bps in September alone, before climbing to 4.81% on October 3, its highest closing yield dating back to October of 2007. The catalyst behind the bulk of the move higher in yields during September was the FOMC meeting mid-month. Most notably, the committee’s updated summary of economic projections, more commonly known as the dot plot, removed two projected 25-basis-point rate cuts from both 2024 and 2025. The dot plot’s shift higher has forced market participants to in turn ratchet upward expectations for where the Fed funds rate could be at the end of next year. Fed funds futures now price in a 4.75% rate in December of 2024, which is well above where the futures market expected Fed funds to be even at the end of 2023 following the failure of Silicon Valley Bank in March.
Fed Funds Target Rate: Current vs. Past Expectations
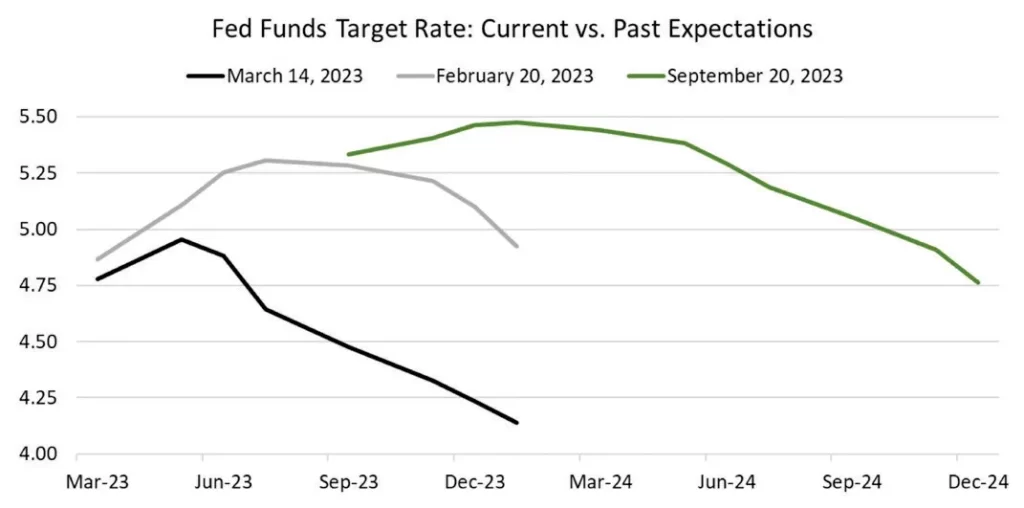
Source: Bloomberg
Over the past 15 years, market participants have been conditioned to expect the FOMC to come to the market’s rescue at the first signs of trouble in the U.S. economy or credit market. However, with higher for longer rates increasing the likelihood of something breaking in those areas, investors are being forced to view the Fed and policymakers in D.C. as willing participants to any economic or market turmoil that occurs this time around. Core inflation is expected to rise around 4% year over year in September, close to twice the FOMC’s 2% target. Furthermore, with average hourly earnings
rising 4.2% year over year during the month, the U.S. economy is far from faltering to the degree necessary to force the FOMC to alter its current monetary policy stance. On the contrary, the FOMC likely views the sharp move higher in Treasury yields as most welcome given it tightens financial conditions via increased borrowing costs.
The market views the odds of another quarter-point hike this year as a coin flip. However, with rising interest rates a global phenomenon, what the FOMC does or doesn’t do may matter little over the near term. A duration profile in line with that of the Bloomberg Aggregate Bond index, which now yields 5.5%, remains our recommended positioning. Despite the recent rally we have seen this week, we have little interest in attempting to call a top in Treasury yields as we see validity in the argument that yields could rise further due to increased issuance and sticky inflation or could roll over due to a slowing economy.
Investment-grade corporate bonds were yielding 6.2% in early October. Due to our expectation that economic growth will likely slow over coming months, we continue to prefer higher-quality corporates versus their higher-yielding brethren. Valuations are likely a better indicator of demand rather than true credit concerns given how well capitalized issuers are in the investment grade space. However, we wouldn’t be surprised if some companies already under review are subjected to downgrades as the economy weakens. Current IG yields are interesting as they reach new highs for this cycle, but patience is warranted in the near future given that longer durations for IG corporates could lead to additional near-term drawdown should Treasury yields rise further.
Yield-To-Worst Range Over the Trailing 10-Years
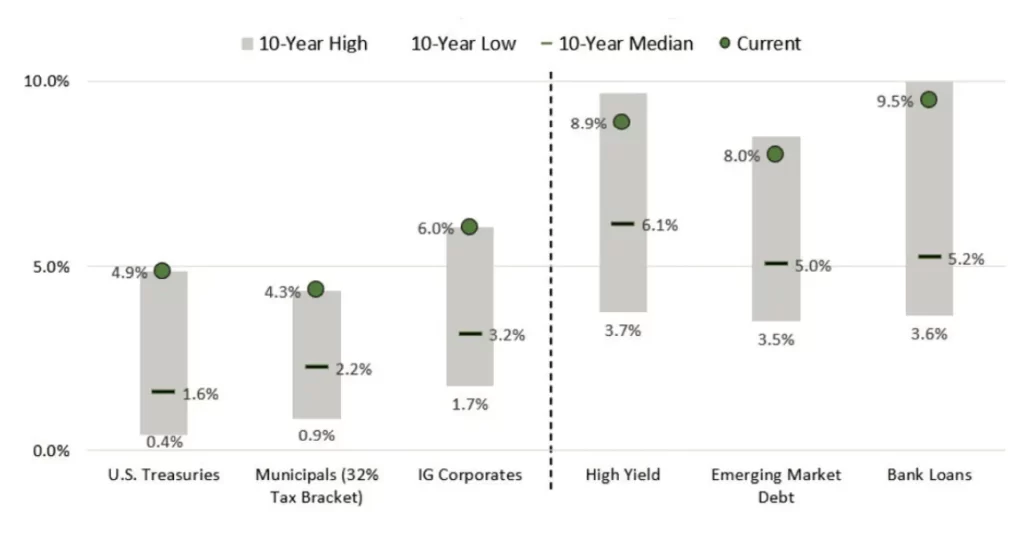
Source: Bloomberg
Highland Associates Cross Asset Views
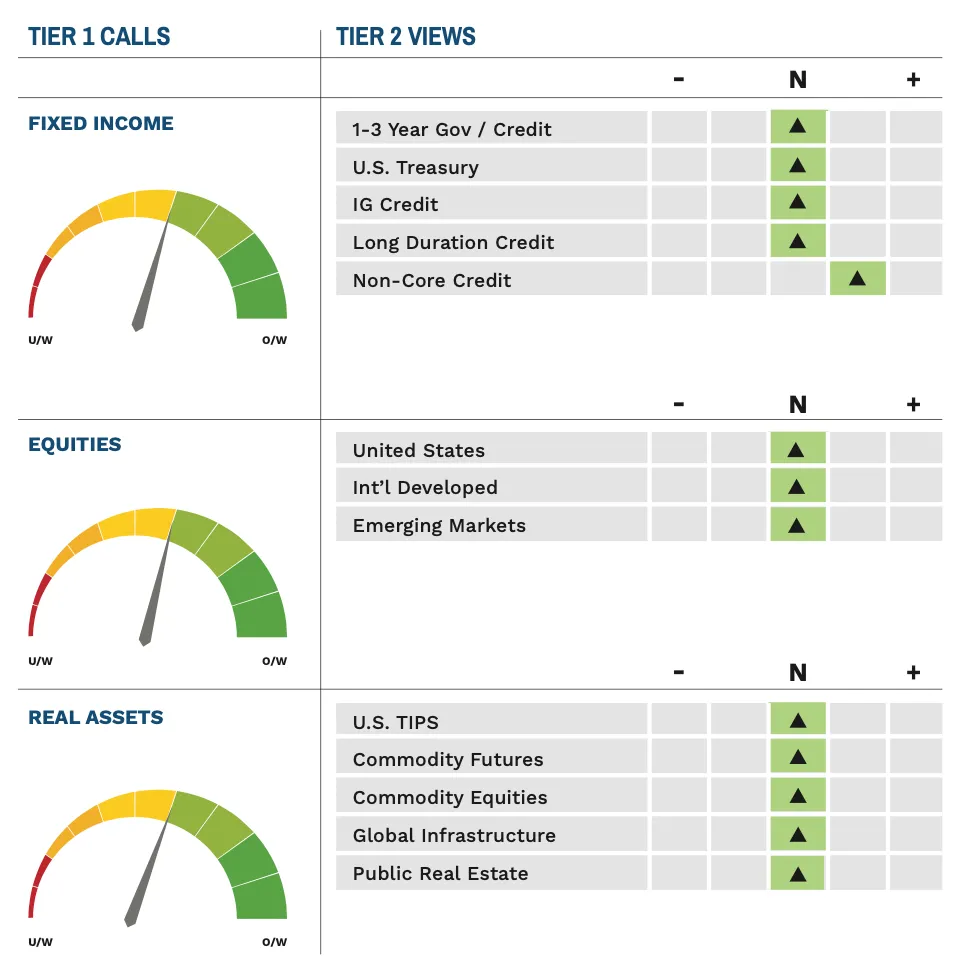
As of 10/16/2023
IMPORTANT DISCLOSURES: This publication has been prepared by the staff of Highland Associates, Inc. for distribution to, among others, Highland Associates, Inc. clients. Highland Associates is registered with the United States Security and Exchange Commission under the Investment Advisors Act of 1940. Highland Associates is a wholly owned subsidiary of Regions Bank, which in turn is a wholly owned subsidiary of Regions Financial Corporation. Research services are provided through Multi-Asset Solutions, a department of the Regions Asset Management business group within Regions Bank. The information and material contained herein is provided solely for general information purposes only. To the extent these materials reference Regions Bank data, such materials are not intended to be reflective or indicative of, and should not be relied upon as, the results of operations, financial conditions or performance of Regions Bank. Unless otherwise specifically stated, any views, opinions, analyses, estimates and strategies, as the case may be (“views”), expressed in this content are those of the respective authors and speakers named in those pieces and may differ from those of Regions Bank and/or other Regions Bank employees and affiliates. Views and estimates constitute our judgment as of the date of these materials, are often based on current market conditions, and are subject to change without notice. Any examples used are generic, hypothetical and for illustration purposes only. Any prices/quotes/statistics included have been obtained from sources believed to be reliable, but Highland Associates, Inc. does not warrant their completeness or accuracy. This information in no way constitutes research and should not be treated as such. The views expressed herein should not be construed as individual investment advice for any particular person or entity and are not intended as recommendations of particular securities, financial instruments, strategies or banking services for a particular person or entity. The names and marks of other companies or their services or products may be the trademarks of their owners and are used only to identify such companies or their services or products and not to indicate endorsement, sponsorship, or ownership by Regions or Highland Associates. Employees of Highland Associates, Inc., may have positions in securities or their derivatives that may be mentioned in this report. Additionally, Highland’s clients and companies affiliated with Highland Associates may hold positions in the mentioned companies in their portfolios or strategies. This material does not constitute an offer or an invitation by or on behalf of Highland Associates to any person or entity to buy or sell any security or financial instrument or engage in any banking service. Nothing in these materials constitutes investment, legal, accounting or tax advice. Non-deposit products including investments, securities, mutual funds, insurance products, crypto assets and annuities: Are Not FDIC-Insured I Are Not a Deposit I May Go Down in Value I Are Not Bank Guaranteed I Are Not Insured by Any Federal Government Agency I Are Not a Condition of Any Banking Activity.
Neither Regions Bank nor Regions Asset Management (collectively, “Regions”) are registered municipal advisors nor provide advice to municipal entities or obligated persons with respect to municipal financial products or the issuance of municipal securities (including regarding the structure, timing, terms and similar matters concerning municipal financial products or municipal securities issuances) or engage in the solicitation of municipal entities or obligated persons for such services. With respect to this presentation and any other information, materials or communications provided by Regions, (a) Regions is not recommending an action to any municipal entity or obligated person, (b) Regions is not acting as an advisor to any municipal entity or obligated person and does not owe a fiduciary duty pursuant to Section 15B of the Securities Exchange Act of 1934 to any municipal entity or obligated person with respect to such presentation, information, materials or communications, (c) Regions is acting for its own interests, and (d) you should discuss this presentation and any such other information, materials or communications with any and all internal and external advisors and experts that you deem appropriate before acting on this presentation or any such other information, materials or communications.
Source: Bloomberg Index Services Limited. BLOOMBERG® is a trademark and service mark of Bloomberg Finance L.P. and its affiliates (collectively “Bloomberg”). BARCLAYS® is a trademark and service mark of Barclays Bank Plc (collectively with its affiliates, “Barclays”), used under license. Bloomberg or Bloomberg’s licensors, including Barclays, own all proprietary rights in the Bloomberg Barclays Indices. Neither Bloomberg nor Barclays approves or endorses this material or guarantees the accuracy or completeness of any information herein, or makes any warranty, express or implied, as to the results to be obtained therefrom and, to the maximum extent allowed by law, neither shall have any liability or responsibility for injury or damages arising in connection therewith.