Stocks: Interest Rate Volatility Weighing On Investor Risk Appetite; Dollar Strength Not Yet A Headwind For Energy Stocks.
Download Weekly Market Commentary | October 2 2023
Key Observations
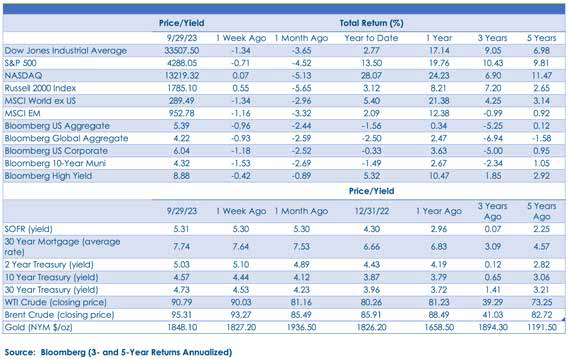
- Large-cap stocks (S&P 500) ran in place last week as interest rate volatility continued to make investors uneasy. The S&P 500 ended the week in negative territory but, encouragingly, the Russell 2000 small-cap index fared better and ended the week with a gain. While one week does not make a trend, small-cap outperformance persisting would be a feather in the cap of equity bulls as 4Q kicks off.
- Developed and emerging market stocks abroad lagged on the week, due largely to weakness out of China and Japan, specifically. U.S. dollar strength and rising energy prices continue to cloud the near-term outlook for the Eurozone, U.K., and emerging markets.
- Interest rate volatility was the story last week, and the 10- year treasury yield rising sharply to close above 4.6% mid- week, a level last seen in October of 2007, is notable.
- September was a tough month for corporate bonds as rising treasury yields and wider credit spreads generated losses for investment-grade and high yield corporate issues.
What We’re Watching:
- The U.S. Purchasing Managers Index (PMI) for September is slated for release Wednesday. A Composite PMI reading of 50.1 is expected, which would be in-line with August and barely above the 50 level that indicates economic activity is generally expanding, while a reading below 50 indicates that activity is generally contracting.
- Eurozone Purchasing Managers Index (PMI) for September is released Wednesday. The PMI Composite is expected to come in at 47.1, in-line with the August reading, while Services PMI is expected to also meet the August reading of 48.4.
- Nonfarm payrolls for September are released Friday with 156.5k jobs expected to have been created during the month, down from 187k in August. The unemployment rate is expected to fall to 3.7% from 3.8% the prior month. Average hourly earnings are expected to rise 0.3% month over month, which would be a modest acceleration from a 0.2% month over month rise in August.
What Happened Last Week:
Stocks: Interest Rate Volatility Weighing On Investor Risk Appetite; Dollar Strength Not Yet A Headwind For Energy Stocks.
Dollar Strength A Headwind For S&P 500 Earnings As Well As Developed And Developing Market Stocks Abroad. The U.S. Dollar Index, or DXY, hit a year-to-date high of 106.76 on Thursday and ended the week higher by 0.8%. A stronger dollar will be a modest headwind for future S&P 500 earnings and could contribute to estimates for 4Q23/1Q24 earnings being ratcheted lower if it is sustained as the S&P 500 generates 30%+ of earnings from abroad. Since the end of July, the consensus estimate for S&P 500 earnings in 2024 has moved higher from $244.49 to $246.70 at present, implying 12.2% earnings growth over 2023, but given the consensus estimate is only projecting sales growth 5.3% year over year, we question how realistic expected profit growth is, and a stronger dollar is another hurdle to achieving that figure. A strong dollar is a headwind for S&P 500 earnings, but it also presents a hurdle for developed and emerging market stocks abroad as it is, on some level, a function of capital flight out of the rest of the world and into U.S.-dollar denominated assets. With dollar strength coinciding with rising energy prices, equities tied to the U.K., Eurozone, and commodity-importing emerging economies could remain under pressure until the uptrend in the dollar and/or energy prices reverses course, which may not materialize until early ’24 given the economic malaise in Europe with colder months approaching.
Crude Oil, Energy Equities Remain Resilient Despite Dollar Rally. West Texas Intermediate (WTI) crude oil continued to rally last week, briefly touching $94.74 per barrel on Thursday before settling out at $90.79 for a 0.8% weekly gain and a whopping 28.5% return in the 3rd quarter. Not to be overlooked, the S&P 500 energy sector rallied another 1.2% last week, and posted a respectable 12.1% quarterly return, easily besting the S&P 500’s 3.2% loss over that time frame. With Saudi Arabia, specifically, constraining supply through year-end, at a minimum, and with colder winter months fast approaching, WTI and other energy-related commodities appear to have the wind at their sails for months to come. The adage “the cure for higher oil prices is higher oil prices” is top of mind for OPEC+ and the cartel appears quite comfortable with crude oil trading in the $90 to $100 per barrel range as opposed to seeing a price spike well above $100 that leads to demand destruction. As a byproduct of Saudi Arabia’s newfound focus on price stability vs. maintaining or taking market share, it’s likely that the supply side of the energy equation will keep upward pressure on prices, independent of where the U.S. dollar might go from here. Energy stocks will likely continue to fare relatively well given this backdrop, but the sector should no longer be considered unloved or under owned after a 12%+ three-month gain, so while we continue to like the sector on a relative basis, it may be stretched over the near-term.
Bonds: Treasury Yields Peaking Or Taking A Breather Before Resuming Their Uptrend; Some Cracks In Corporate Bonds Beginning To Show; Bank Of Japan Worth Watching As A Driver Of Treasury Yields.
Are Yields Peaking, Or Is 4.50% A New Floor Of Support For the 10-Year Treasury Yield? We May Find Out Soon. On the surface, the 10-year U.S. treasury yield rising 13 basis points last week might not seem noteworthy, but those following the day-to-day movements in yields would likely beg to differ with that assessment. The 10-year yield briefly eclipsed the 4.65% level last Thursday before in-line to ‘cool’ inflation data brought buyers back in and forced yields lower with the 10-year yield ending the week at 4.57%. The 10-year treasury yield has risen by over 40-basis points since the end of August and investors are now asking just how high yields can go before something breaks and the Fed is forced to alter policy to stem the rise in yields. While we have little confidence in venturing a guess as to where yields might peak out, from a technical perspective, how the 10-year yield continues to respond at/around the 4.50% level will go a long way in providing hints as to where yields are going next. A sustained break below 4.50% could turn that level into strong resistance and could point toward yields moving lower over the near-to-intermediate-term. But with that level providing a springboard for yields to bounce higher early last week, if the 10-year yield moves sideways around that level and fails to break below it, the uptrend will likely remain in place. At present, those betting on higher yields appear best positioned for gains due to rising energy prices and a lack of near-term catalysts to force short covering and push yields much lower. However, at some point, higher yields will attract investors seeking to lock- in higher rates for the long-term, and while bond bears have the momentum right now, yields have moved very far very fast and as a result yields could become range- bound leading up to the November 1-2 FOMC meeting as investors digest upcoming economic and inflation data.
Upward Pressure On Global Sovereign Bond Yields Likely To Persist. Yields on U.S. treasury bonds continued to climb last week, with the most noteworthy moves taking place in the 5- to 10-year portion of the yield curve. The closely watched 10-year treasury ended the week with a yield of 4.57%, up from 4.44% the prior week even as buyers begrudgingly stepped in on the heels of cooler inflation data out of both the U.S. and the Eurozone. Higher yields remain a global phenomenon as sovereign bond yields across the Eurozone made similar moves skyward last week, and a potential policy shift out of the Bank of Japan (BoJ) over coming months could put additional upward pressure on sovereign bond yields in the U.S. and abroad into year-end.
Tiny Cracks In Credit Worth Watching. September proved to be a challenging month for corporate bonds, broadly speaking, and was particularly tough on investment-grade credits with greater sensitivity to rising treasury yields. The Bloomberg Corporate Bond index fell 2.6% on a total return basis during September and closed out the month with a yield-to-worst (YTW) of 6.04%, a yield last seen in October of 2022 at the peak of pessimism and around the time that the S&P 500’s bottomed and made a 52-week low. The Bloomberg U.S. High Yield index closed the month with a YTW of 8.8% after a -1.1% monthly drop as the index’s higher yield partially offset price declines in lower quality credits. The High Yield index is up by 5.8% year- to-date, far outpacing the flat return out of the investment-grade corporate index, but with economic uncertainty persisting over coming months, we maintain a preference for higher quality bonds.
August Inflation Data Cools, Generating A Half-Hearted Bid For Treasuries. We Still See Yields Moving Higher. August Personal Consumption Expenditure (PCE) Deflator, the Fed’s preferred inflation gauge, was released Friday. Core PCE Deflator rose 0.14% month over month, below the 0.2% estimate, and the 0.22% month over month reading in July. Year over year, Core PCE Deflator rose 3.9%, in-line with the consensus estimate and, encouragingly, the 3.9% year over year reading was well below the 4.3% reading in July, a downshift that will be viewed positively by the Federal pen Market Committee (FOMC). Cooler inflation data coaxed buyers back into now higher yielding long- dated U.S. treasuries into the weekend, but with energy prices elevated and pressure mounting on the Bank of Japan to support the yen, which has pushed yields on Japanese Government Bonds higher, rallies in long bonds may be muted and short-lived into year-end.
IMPORTANT DISCLOSURES: THIS PUBLICATION HAS BEEN PREPARED BY THE STAFF OF HIGHLAND ASSOCIATES, INC. FOR DISTRIBUTION TO, AMONG OTHERS, HIGHLAND ASSOCIATES, INC. CLIENTS. HIGHLAND ASSOCIATES IS REGISTERED WITH THE UNITED STATES SECURITY AND EXCHANGE COMMISSION UNDER THE INVESTMENT ADVISORS ACT OF 1940. HIGHLAND ASSOCIATES IS A WHOLLY OWNED SUBSIDIARY OF REGIONS BANK, WHICH IN TURN IS A WHOLLY OWNED SUBSIDIARY OF REGIONS FINANCIAL CORPORATION. RESEARCH SERVICES ARE PROVIDED THROUGH MULTI-ASSET SOLUTIONS, A DEPARTMENT OF THE REGIONS ASSET MANAGEMENT BUSINESS GROUP WITHIN REGIONS BANK. THE INFORMATION AND MATERIAL CONTAINED HEREIN IS PROVIDED SOLELY FOR GENERAL INFORMATION PURPOSES ONLY. TO THE EXTENT THESE MATERIALS REFERENCE REGIONS BANK DATA, SUCH MATERIALS ARE NOT INTENDED TO BE REFLECTIVE OR INDICATIVE OF, AND SHOULD NOT BE RELIED UPON AS, THE RESULTS OF OPERATIONS, FINANCIAL CONDITIONS OR PERFORMANCE OF REGIONS BANK. UNLESS OTHERWISE SPECIFICALLY STATED, ANY VIEWS, OPINIONS, ANALYSES, ESTIMATES AND STRATEGIES, AS THE CASE MAY BE (“VIEWS”), EXPRESSED IN THIS CONTENT ARE THOSE OF THE RESPECTIVE AUTHORS AND SPEAKERS NAMED IN THOSE PIECES AND MAY DIFFER FROM THOSE OF REGIONS BANK AND/OR OTHER REGIONS BANK EMPLOYEES AND AFFILIATES. VIEWS AND ESTIMATES CONSTITUTE OUR JUDGMENT AS OF THE DATE OF THESE MATERIALS, ARE OFTEN BASED ON CURRENT MARKET CONDITIONS, AND ARE SUBJECT TO CHANGE WITHOUT NOTICE. ANY EXAMPLES USED ARE GENERIC, HYPOTHETICAL AND FOR ILLUSTRATION PURPOSES ONLY. ANY PRICES/QUOTES/STATISTICS INCLUDED HAVE BEEN OBTAINED FROM SOURCES BELIEVED TO BE RELIABLE, BUT HIGHLAND ASSOCIATES, INC. DOES NOT WARRANT THEIR COMPLETENESS OR ACCURACY. THIS INFORMATION IN NO WAY CONSTITUTES RESEARCH AND SHOULD NOT BE TREATED AS SUCH. THE VIEWS EXPRESSED HEREIN SHOULD NOT BE CONSTRUED AS INDIVIDUAL INVESTMENT ADVICE FOR ANY PARTICULAR PERSON OR ENTITY AND ARE NOT INTENDED AS RECOMMENDATIONS OF PARTICULAR SECURITIES, FINANCIAL INSTRUMENTS, STRATEGIES OR BANKING SERVICES FOR A PARTICULAR PERSON OR ENTITY. THE NAMES AND MARKS OF OTHER COMPANIES OR THEIR SERVICES OR PRODUCTS MAY BE THE TRADEMARKS OF THEIR OWNERS AND ARE USED ONLY TO IDENTIFY SUCH COMPANIES OR THEIR SERVICES OR PRODUCTS AND NOT TO INDICATE ENDORSEMENT, SPONSORSHIP, OR OWNERSHIP BY REGIONS OR HIGHLAND ASSOCIATES. EMPLOYEES OF HIGHLAND ASSOCIATES, INC., MAY HAVE POSITIONS IN SECURITIES OR THEIR DERIVATIVES THAT MAY BE MENTIONED IN THIS REPORT. ADDITIONALLY, HIGHLAND’S CLIENTS AND COMPANIES AFFILIATED WITH HIGHLAND ASSOCIATES MAY HOLD POSITIONS IN THE MENTIONED COMPANIES IN THEIR PORTFOLIOS OR STRATEGIES. THIS MATERIAL DOES NOT CONSTITUTE AN OFFER OR AN INVITATION BY OR ON BEHALF OF HIGHLAND ASSOCIATES TO ANY PERSON OR ENTITY TO BUY OR SELL ANY SECURITY OR FINANCIAL INSTRUMENT OR ENGAGE IN ANY BANKING SERVICE. NOTHING IN THESE MATERIALS CONSTITUTES INVESTMENT, LEGAL, ACCOUNTING OR TAX ADVICE. NON-DEPOSIT PRODUCTS INCLUDING INVESTMENTS, SECURITIES, MUTUAL FUNDS, INSURANCE PRODUCTS, CRYPTO ASSETS AND ANNUITIES: ARE NOT FDIC-INSURED I ARE NOT A DEPOSIT I MAY GO DOWN IN VALUE I ARE NOT BANK GUARANTEED I ARE NOT INSURED BY ANY FEDERAL GOVERNMENT AGENCY I ARE NOT A CONDITION OF ANY BANKING ACTIVITY.
NEITHER REGIONS BANK NOR REGIONS ASSET MANAGEMENT (COLLECTIVELY, “REGIONS”) ARE REGISTERED MUNICIPAL ADVISORS NOR PROVIDE ADVICE TO MUNICIPAL ENTITIES OR OBLIGATED PERSONS WITH RESPECT TO MUNICIPAL FINANCIAL PRODUCTS OR THE ISSUANCE OF MUNICIPAL SECURITIES (INCLUDING REGARDING THE STRUCTURE, TIMING, TERMS AND SIMILAR MATTERS CONCERNING MUNICIPAL FINANCIAL PRODUCTS OR MUNICIPAL SECURITIES ISSUANCES) OR ENGAGE IN THE SOLICITATION OF MUNICIPAL ENTITIES OR OBLIGATED PERSONS FOR SUCH SERVICES. WITH RESPECT TO THIS PRESENTATION AND ANY OTHER INFORMATION, MATERIALS OR COMMUNICATIONS PROVIDED BY REGIONS, (A) REGIONS IS NOT RECOMMENDING AN ACTION TO ANY MUNICIPAL ENTITY OR OBLIGATED PERSON, (B) REGIONS IS NOT ACTING AS AN ADVISOR TO ANY MUNICIPAL ENTITY OR OBLIGATED PERSON AND DOES NOT OWE A FIDUCIARY DUTY PURSUANT TO SECTION 15B OF THE SECURITIES EXCHANGE ACT OF 1934 TO ANY MUNICIPAL ENTITY OR OBLIGATED PERSON WITH RESPECT TO SUCH PRESENTATION, INFORMATION, MATERIALS OR COMMUNICATIONS, (C) REGIONS IS ACTING FOR ITS OWN INTERESTS, AND (D) YOU SHOULD DISCUSS THIS PRESENTATION AND ANY SUCH OTHER INFORMATION, MATERIALS OR COMMUNICATIONS WITH ANY AND ALL INTERNAL AND EXTERNAL ADVISORS AND EXPERTS THAT YOU DEEM APPROPRIATE BEFORE ACTING ON THIS PRESENTATION OR ANY SUCH OTHER INFORMATION, MATERIALS OR COMMUNICATIONS.
SOURCE: BLOOMBERG INDEX SERVICES LIMITED. BLOOMBERG® IS A TRADEMARK AND SERVICE MARK OF BLOOMBERG FINANCE L.P. AND ITS AFFILIATES (COLLECTIVELY “BLOOMBERG”). BARCLAYS® IS A TRADEMARK AND SERVICE MARK OF BARCLAYS BANK PLC (COLLECTIVELY WITH ITS AFFILIATES, “BARCLAYS”), USED UNDER LICENSE. BLOOMBERG OR BLOOMBERG’S LICENSORS, INCLUDING BARCLAYS, OWN ALL PROPRIETARY RIGHTS IN THE BLOOMBERG BARCLAYS INDICES. NEITHER BLOOMBERG NOR BARCLAYS APPROVES OR ENDORSES THIS MATERIAL OR GUARANTEES THE ACCURACY OR COMPLETENESS OF ANY INFORMATION HEREIN, OR MAKES ANY WARRANTY, EXPRESS OR IMPLIED, AS TO THE RESULTS TO BE OBTAINED THEREFROM AND, TO THE MAXIMUM EXTENT ALLOWED BY LAW, NEITHER SHALL HAVE ANY LIABILITY OR RESPONSIBILITY FOR INJURY OR DAMAGES ARISING IN CONNECTION THEREWITH.